Alabama Math A1P.DSP.A
Standard Cluster
Mathematical and statistical reasoning about data can be used to evaluate conclusions and assess risks.
2019 Alabama Course of Study: Mathematics · Algebra I With Probability
Cluster contents
Standards in This Cluster
A1P.DSP.A is a cluster heading. These are the individual standards under it.
Teacher's field guide
What This Cluster Means
What Students Need to Do
- Students compare risks using rates, not just counts. They decide whether data supports a claim and name what the data cannot tell them.
What Mastery Looks Like
- A student can calculate that 8 injuries among 200 players is 4%, while 6 among 100 is 6%. They can identify the higher observed rate without claiming the sport caused the difference.
Common Misconceptions
- Students may compare 8 injuries with 6 and ignore the group sizes. They may treat a higher rate as proof of a cause or assume a reported risk predicts what will happen to one person.
How to Assess It
- Ask: “A school reports 8 injuries among 200 soccer players and 6 among 100 basketball players. Which group had the higher observed injury rate? Why can’t these numbers prove the sport caused the difference?”
Lesson moves
Ways to Teach It
Put 2 red counters in one bag of 10 and 4 in another; students draw 20 times with replacement and compare results.
Ask students to write whether 3 injuries among 100 helmet riders and 12 among 200 nonhelmet riders prove helmets prevented injuries.
Print cards showing 4/20 vs 6/60, 8/100 vs 8/200, and 3/10 vs 30/100; pairs race to rank risks.
Show two bus routes with 2 late arrivals in 20 trips and 5 in 100; students choose a route and explain why.
Free download
Printable A1P.DSP.A Worksheet
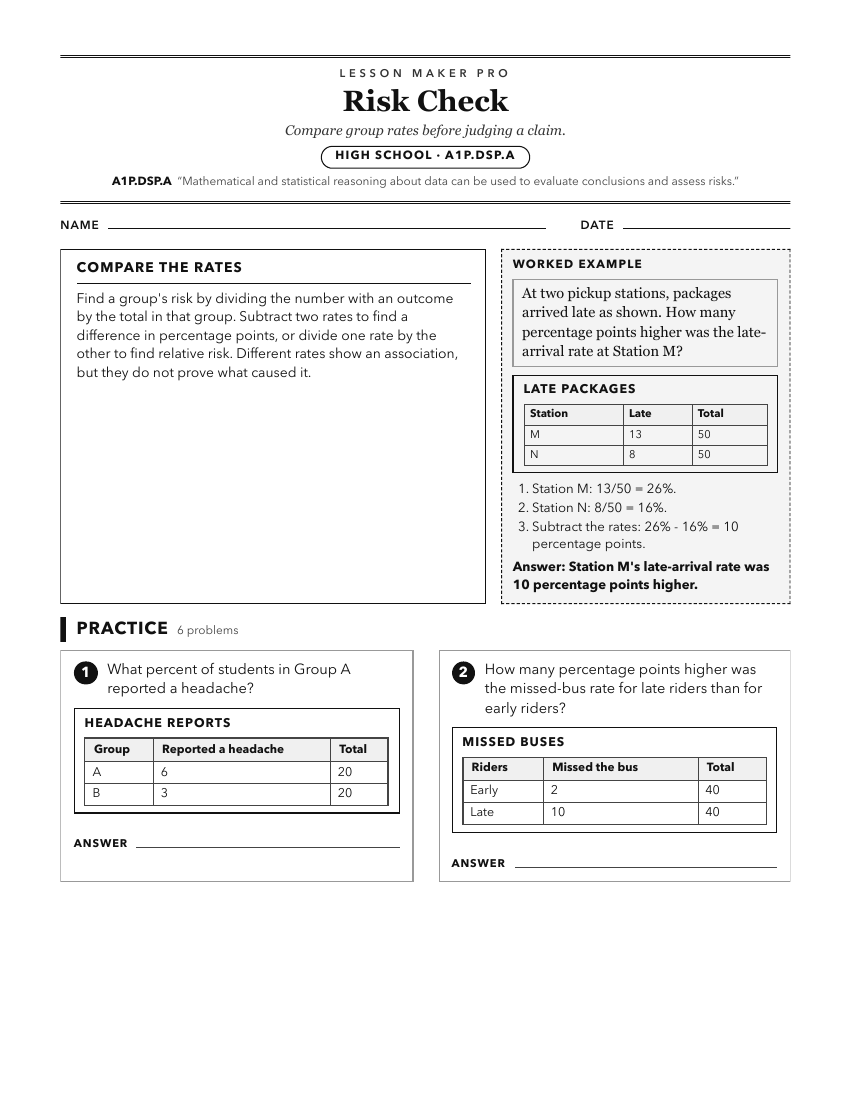
A ready-to-print activity worksheet aligned to A1P.DSP.A, with an answer key for the teacher on its own page. No account needed.
PDF, US Letter, prints cleanly in black and white.
Download the worksheetKeep exploring
Related Standards
- GDA.DSP.A
Mathematical and statistical reasoning about data can be used to evaluate conclusions and assess risks.
- A2S.DSP.A
Mathematical and statistical reasoning about data can be used to evaluate conclusions and assess risks.
- 8A.DSP.E
Mathematical and statistical reasoning about data can be used to evaluate conclusions and assess risks.
- GDA.DSP.A.7
Use mathematical and statistical reasoning with quantitative data, both univariate data (set of values) and bivariate data (set of pairs of values) that suggest...
Turn this cluster into a lesson
Grade, subject, topic, and the complete cluster are prefilled. Create one free, no account needed.
Also for this cluster:Make a WorksheetMake a QuizMake a Sub Lesson