Alabama Math A1P.DSP.A.32
The Standard
- A1P.DSP.A
- Mathematical and statistical reasoning about data can be used to evaluate conclusions and assess risks.
Use mathematical and statistical reasoning with bivariate categorical data in order to draw conclusions and assess risk.
2019 Alabama Course of Study: Mathematics
Teacher's field guide
What This Standard Means
What Students Need to Do
- Sort paired category data into a two-way table. Find the outcome rate within each group, compare the rates, and explain what the comparison says about risk.
What Mastery Looks Like
- Given 8 late trips out of 20 rainy trips and 8 out of 80 dry trips, students calculate late rates of 40% and 10%. They say a rainy trip was four times as likely to be late in this data, without claiming rain caused the delays.
Common Misconceptions
- Students may see 8 late trips in each group and call the risks equal, ignoring the different group sizes. Some divide by all trips instead of each group total, or treat a link between categories as proof of cause.
How to Assess It
- Exit ticket: Of 30 rainy trips, 12 ran late; of 90 dry trips, 18 ran late. Find each late-trip rate, name the higher-risk group, and say whether the data proves rain caused the delays.
Lesson moves
Ways to Teach It
Give pairs 10 rainy-trip cards, 4 marked late, and 40 dry-trip cards, 4 marked late; sort them into a two-way table.
Ask students whether four late trips in each weather group means equal risk, and have them back their answer with rates.
Put 6 late of 15 rainy trips and 9 of 45 dry trips on the board; teams race to find the higher-risk group.
Show a mock store returns sheet: 5 of 25 online orders and 6 of 60 in-store orders returned; compare return rates.
Free download
Printable A1P.DSP.A.32 Worksheet
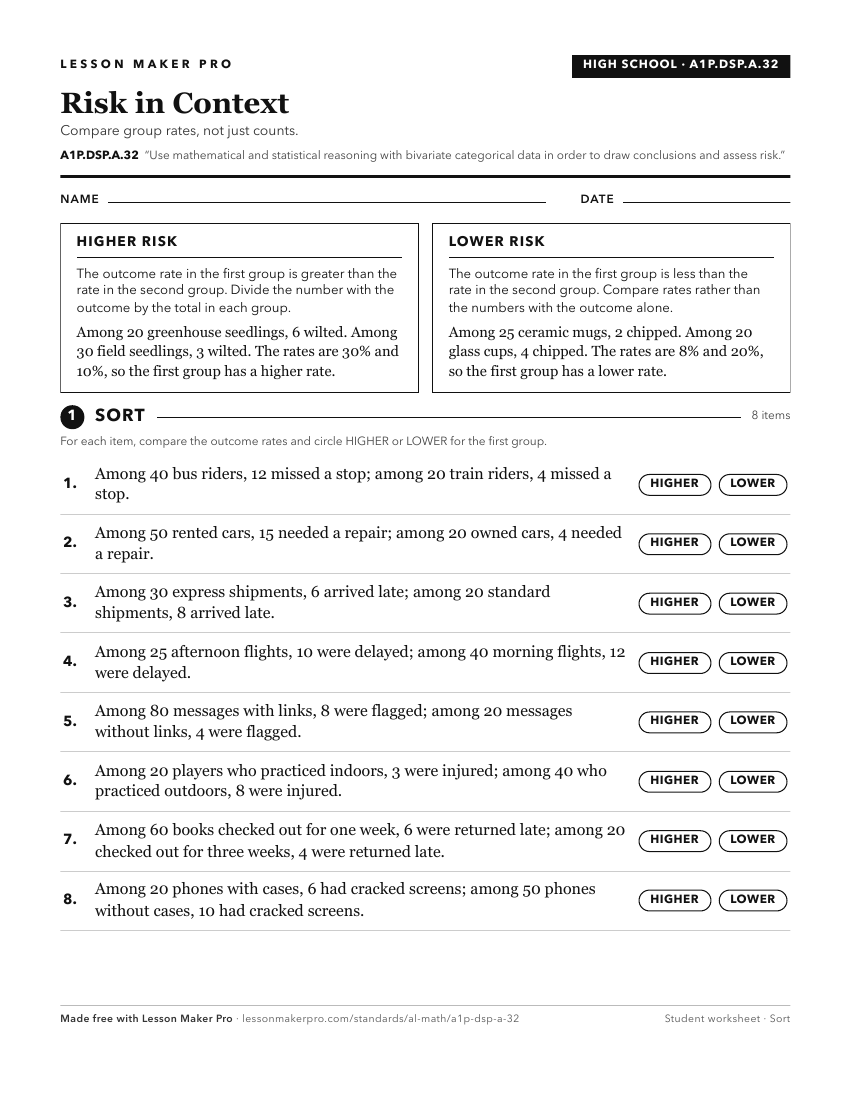
A ready-to-print activity worksheet aligned to A1P.DSP.A.32, with an answer key for the teacher on its own page. No account needed.
PDF, US Letter, prints cleanly in black and white.
Download the worksheetKeep exploring
Related Standards
- 8A.DSP.E.41
Use mathematical and statistical reasoning with bivariate categorical data in order to draw conclusions and assess risk.
- GDA.DSP.A.7
Use mathematical and statistical reasoning with quantitative data, both univariate data (set of values) and bivariate data (set of pairs of values) that suggest...
- 8A.DSP.E
Mathematical and statistical reasoning about data can be used to evaluate conclusions and assess risks.
- A2S.DSP.A
Mathematical and statistical reasoning about data can be used to evaluate conclusions and assess risks.
Turn this exact standard into a lesson
Grade, subject, topic, and the complete standard are prefilled. Create one free, no account needed.
Also for this standard:Make a WorksheetMake a QuizMake a Sub Lesson