Alabama Math 8A.DSP.E.41
The Standard
- 8A.DSP.E
- Mathematical and statistical reasoning about data can be used to evaluate conclusions and assess risks.
Use mathematical and statistical reasoning with bivariate categorical data in order to draw conclusions and assess risk.
2019 Alabama Course of Study: Mathematics
Teacher's field guide
What This Standard Means
What Students Need to Do
- Students sort data by two traits, such as helmet use and injury, in a two-way table. They compare the share injured in each group and explain what the comparison can and cannot show.
What Mastery Looks Like
- Given 5 injuries among 25 helmet wearers and 12 among 30 nonwearers, a student finds injury rates of 20% and 40%. They say injury was more common among nonwearers in this sample, without claiming the data prove why.
Common Misconceptions
- Students compare injury counts without checking group sizes. They divide by the total number of riders instead of each group's total. Some treat a difference in rates as proof of cause.
How to Assess It
- Exit ticket: Of 20 helmet wearers, 4 were injured. Of 10 nonwearers, 3 were injured. Find each injury rate, name the group with the higher rate, and say whether the data prove why.
Lesson moves
Ways to Teach It
Give pairs 20 slips: eight helmet wearers, two injured; 12 nonwearers, six injured. Have them sort the slips and calculate injury rates.
Ask: If helmet wearers have fewer injuries, does that prove helmets prevented them? What else might differ between the groups?
Run a rate race: pairs compare 6 injuries among 30 helmet wearers with 4 among 10 nonwearers, then explain their choice.
Show a mock bike-safety poster claiming '12 injuries without helmets versus 5 with helmets.' Ask what group totals the poster leaves out.
Free download
Printable 8A.DSP.E.41 Worksheet
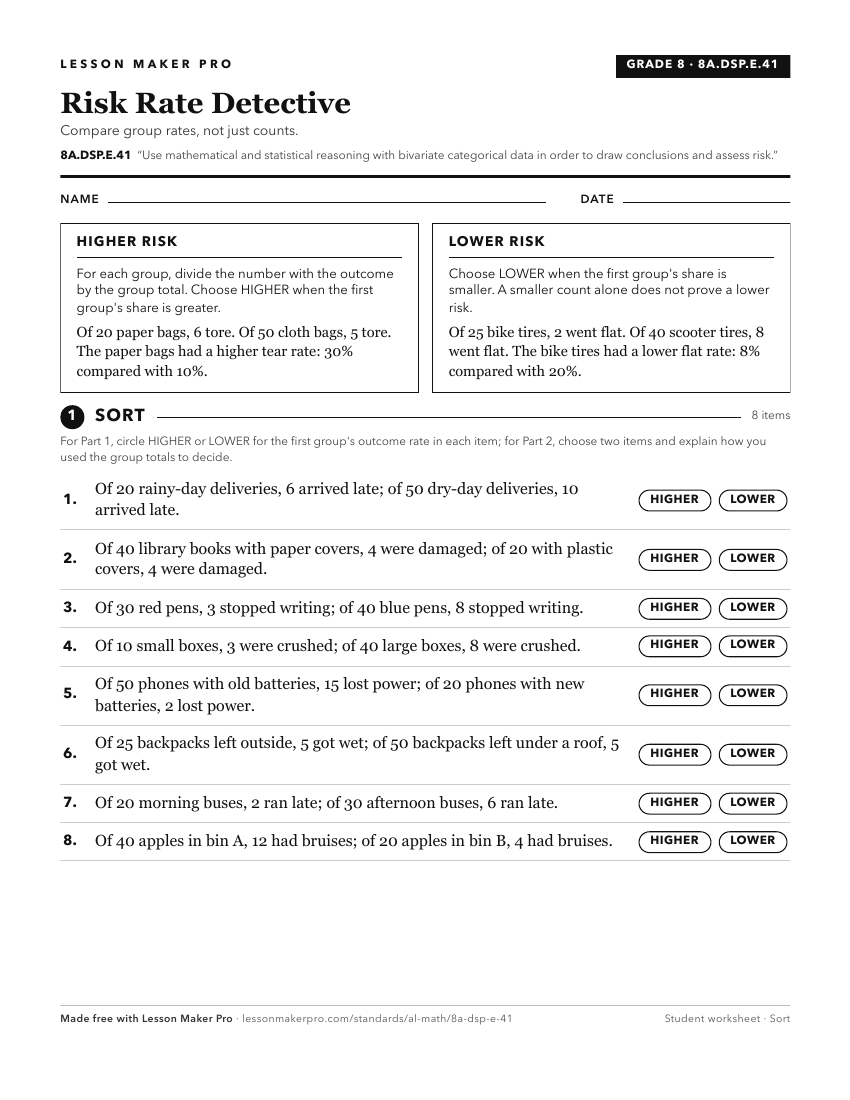
A ready-to-print activity worksheet aligned to 8A.DSP.E.41, with an answer key for the teacher on its own page. No account needed.
PDF, US Letter, prints cleanly in black and white.
Download the worksheetKeep exploring
Related Standards
- GDA.DSP.A.7
Use mathematical and statistical reasoning with quantitative data, both univariate data (set of values) and bivariate data (set of pairs of values) that suggest...
- A2S.DSP.A
Mathematical and statistical reasoning about data can be used to evaluate conclusions and assess risks.
- 8A.DSP.E
Mathematical and statistical reasoning about data can be used to evaluate conclusions and assess risks.
- A1P.DSP.A
Mathematical and statistical reasoning about data can be used to evaluate conclusions and assess risks.
Turn this exact standard into a lesson
Grade, subject, topic, and the complete standard are prefilled. Create one free, no account needed.
Also for this standard:Make a WorksheetMake a QuizMake a Sub Lesson