Alabama Math MM.D3D.B.15.a
The Standard
- MM.D3D.B
- Functions can be used to represent general trends in conditions that change over time and to predict future conditions based on present observations.
- MM.D3D.B.15
- Use regression with statistical graphing technology to determine an equation that best fits a set of bivariate data, including nonlinear patterns.
Create a scatter plot with a sufficient number of data points to predict a pattern.
2019 Alabama Course of Study: Mathematics · Functions can be used to represent general trends in conditions that change over time and to predict future conditions based on present observations.
Teacher's field guide
What This Standard Means
What Students Need to Do
- Students plot measurements taken over time, with time on the horizontal axis. They use enough points to see whether a pattern appears, then use that pattern to estimate a later value.
What Mastery Looks Like
- A student labels both axes, plots each pair accurately, and describes the pattern the points show. They make a reasonable prediction and say when scattered points do not support one.
Common Misconceptions
- Students may connect the dots and treat every change between readings as part of the trend. They may also predict from only two or three points, or let one unusual reading determine their prediction.
How to Assess It
- Give students plant heights of 2, 3, 3, 4, 5, 5, 6, and 7 cm for weeks 1 through 8. Ask them to plot the points, estimate week 9, and explain their estimate.
Lesson moves
Ways to Teach It
Give groups graph paper and 12 weekly plant-height measurements; have them plot each pair and estimate the height in week 13.
Show a pond-depth plot with four readings and another with 16; ask which better supports a prediction and why.
Hand pairs 10 shuffled time-and-temperature cards; have them plot the points, predict the next reading, and compare estimates.
Use 12 months of electricity use from a sample bill; have students plot the values and check for a seasonal pattern.
Free download
Printable MM.D3D.B.15.a Worksheet
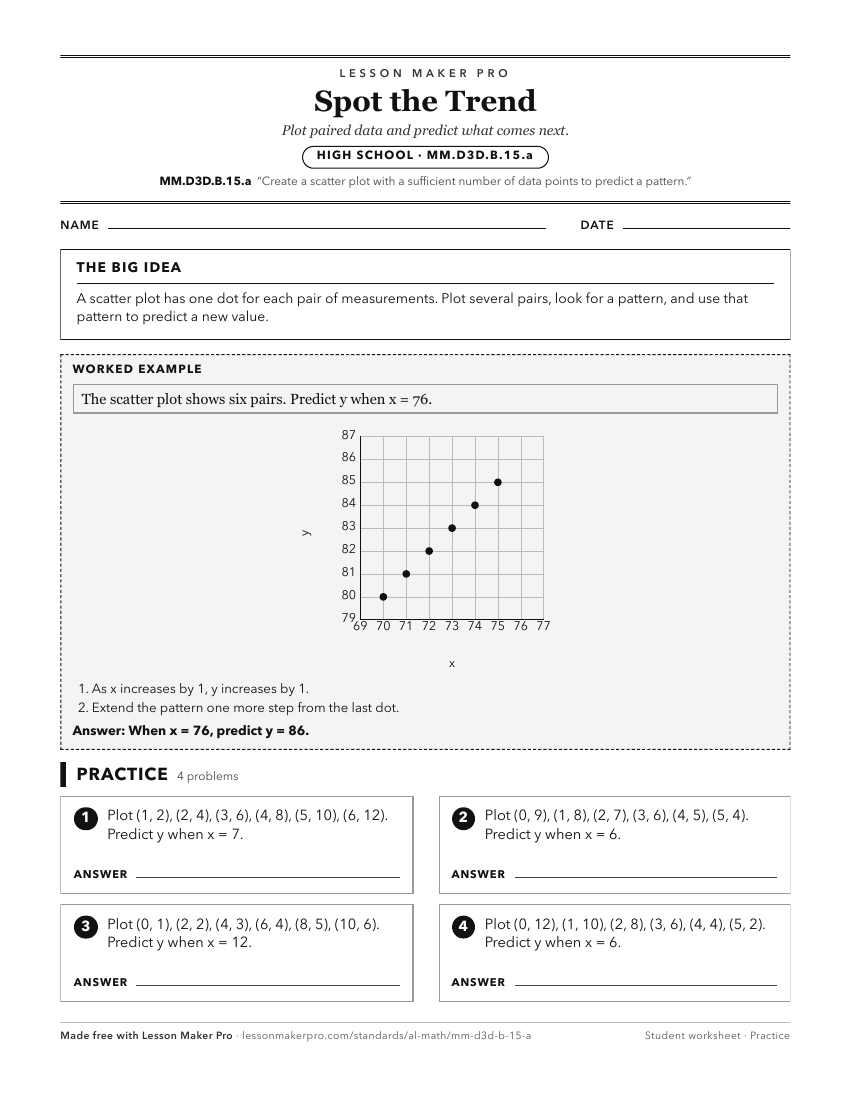
A ready-to-print activity worksheet aligned to MM.D3D.B.15.a, with an answer key for the teacher on its own page. No account needed.
PDF, US Letter, prints cleanly in black and white.
Download the worksheetKeep exploring
Related Standards
- 8.DSP.A.19
Given a scatter plot that suggests a linear association, informally draw a line to fit the data, and assess the model fit by judging the closeness of the data p...
- 8A.DSP.A.35
Given a scatter plot that suggests a linear association, informally draw a line to fit the data, and assess the model fit by judging the closeness of the data p...
- GDA.DSP.D.12.a
Find a linear function for a scatter plot that suggests a linear association and informally assess its fit by plotting and analyzing residuals, including the sq...
- 8A.DSP.A.34
Construct and interpret scatter plots for bivariate measurement data to investigate patterns of association between two quantities, describing patterns in terms...
Turn this exact standard into a lesson
Grade, subject, topic, and the complete standard are prefilled. Create one free, no account needed.
Also for this standard:Make a WorksheetMake a QuizMake a Sub Lesson