Alabama Math GDA.DSP.D.12.a
The Standard
- GDA.DSP.D
- Scatter plots, including plots over time, can reveal patterns, trends, clusters, and gaps that are useful in analyzing the association between two contextual variables.
- GDA.DSP.D.12
- Represent data of two quantitative variables on a scatter plot, and describe how the variables are related.
Find a linear function for a scatter plot that suggests a linear association and informally assess its fit by plotting and analyzing residuals, including the squares of the residuals, in order to improve its fit.
2019 Alabama Course of Study: Mathematics · Scatter plots, including plots over time, can reveal patterns, trends, clusters, and gaps that are useful in analyzing the association between two contextual variables.
Teacher's field guide
What This Standard Means
What Students Need to Do
- Students draw a line that fits a scatter plot and write its equation. They subtract predicted values from actual values, plot those residuals, and use squared residuals to compare lines.
What Mastery Looks Like
- A student can use their equation to make predictions. They choose a line with a low total of squared residuals and no clear pattern in the residual plot. They can explain why it fits better than another line.
Common Misconceptions
- Some students subtract actual values from predicted values, then misread which points lie above the line. Some think squaring a negative residual gives a negative number. Others trust a line because it crosses two points, even when the residuals form a curve.
How to Assess It
- Exit ticket: For (1,58), (2,64), (3,69), (4,76), and (5,81), compare y=6x+52 and y=5x+55 using squared residual totals. Plot the better line's residuals against x and describe any pattern.
Lesson moves
Ways to Teach It
On graph paper, plot hours 1 to 5 and scores 58, 64, 69, 76, 81; draw a line, then graph residuals.
Show residuals above zero at both ends and below zero in the middle; ask what pattern the line misses.
For hours 1 to 5 and scores 58, 64, 69, 76, 81, compare squared residual totals for y=6x+52 and y=5x+55.
Use car ages 1 to 5 and prices $19k, $17k, $15k, $14k, $11k; fit a line and flag the overpriced car.
Free download
Printable GDA.DSP.D.12.a Worksheet
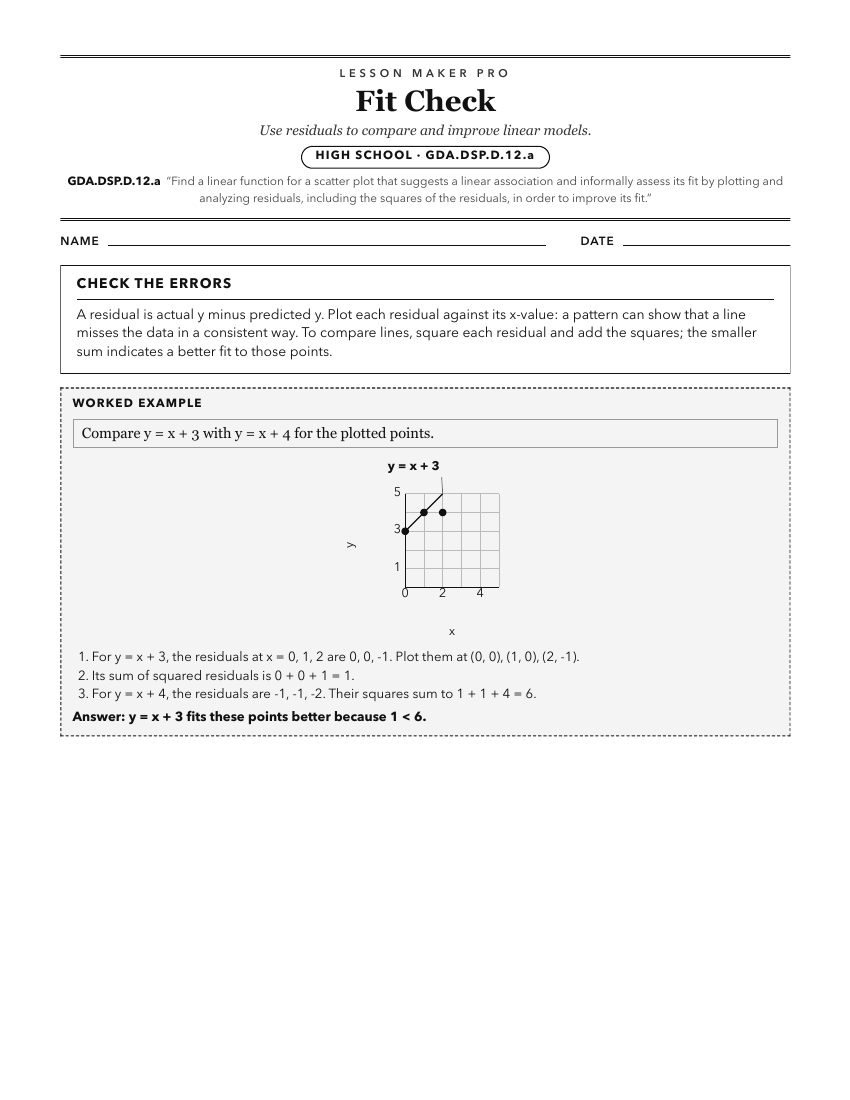
A ready-to-print activity worksheet aligned to GDA.DSP.D.12.a, with an answer key for the teacher on its own page. No account needed.
PDF, US Letter, prints cleanly in black and white.
Download the worksheetKeep exploring
Related Standards
- 8.DSP.A.19
Given a scatter plot that suggests a linear association, informally draw a line to fit the data, and assess the model fit by judging the closeness of the data p...
- 8A.DSP.A.35
Given a scatter plot that suggests a linear association, informally draw a line to fit the data, and assess the model fit by judging the closeness of the data p...
- 8A.DSP.A.34
Construct and interpret scatter plots for bivariate measurement data to investigate patterns of association between two quantities, describing patterns in terms...
Turn this exact standard into a lesson
Grade, subject, topic, and the complete standard are prefilled. Create one free, no account needed.
Also for this standard:Make a WorksheetMake a QuizMake a Sub Lesson