Alabama Math 8A.DSP.A.35
The Standard
- 8A.DSP.A
- Investigate patterns of association in bivariate data.
Given a scatter plot that suggests a linear association, informally draw a line to fit the data, and assess the model fit by judging the closeness of the data points to the line.
2019 Alabama Course of Study: Mathematics
Teacher's field guide
What This Standard Means
What Students Need to Do
- Students draw a straight line through the middle of a scatter plot that shows a roughly linear pattern. They judge the fit by checking how close the points are to the line.
What Mastery Looks Like
- A student draws a line that follows the trend, with points on both sides. They point out any data points far from the line and explain whether most points sit near it.
Common Misconceptions
- Some students connect the dots or try to make the line pass through every point. Others judge the fit by the line's steepness instead of the points' distance from it.
How to Assess It
- On a coordinate grid, plot (1,2), (2,3), (3,3), (4,5), (5,6), and (6,6). Draw a line of fit and explain why it fits the points well or poorly.
Lesson moves
Ways to Teach It
Give pairs a printed scatter plot and a piece of string; move the string until points sit close to it on both sides.
Show two lines on the same scatter plot and ask, 'Which stays closer to most points, and which points are far away?'
Put four scatter plots on cards; have teams draw a line on each and rank the plots from tightest to loosest fit.
Plot sample daily highs and ice cream sales: (60,12), (65,16), (70,17), (75,23), (80,25), (85,29); draw a line and check its fit.
Free download
Printable 8A.DSP.A.35 Worksheet
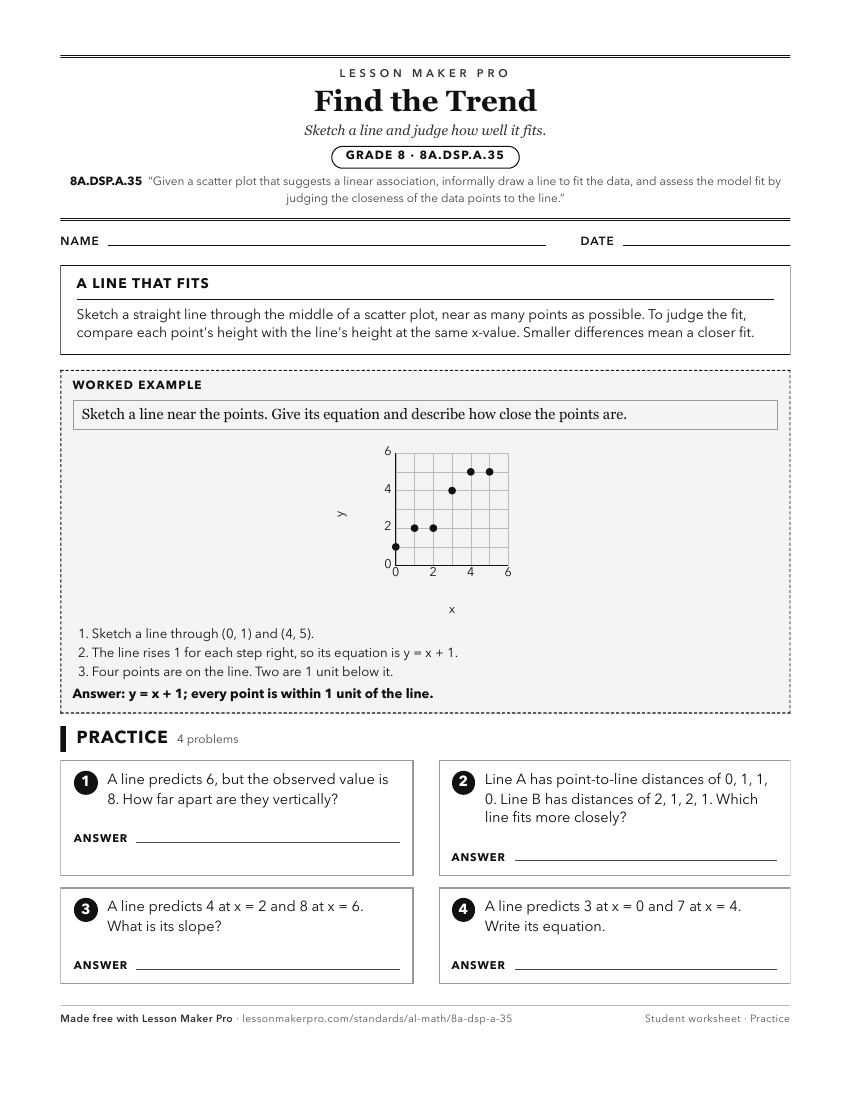
A ready-to-print activity worksheet aligned to 8A.DSP.A.35, with an answer key for the teacher on its own page. No account needed.
PDF, US Letter, prints cleanly in black and white.
Download the worksheetKeep exploring
Related Standards
- 8.DSP.A.19
Given a scatter plot that suggests a linear association, informally draw a line to fit the data, and assess the model fit by judging the closeness of the data p...
- GDA.DSP.D.12.a
Find a linear function for a scatter plot that suggests a linear association and informally assess its fit by plotting and analyzing residuals, including the sq...
- 8A.DSP.A.34
Construct and interpret scatter plots for bivariate measurement data to investigate patterns of association between two quantities, describing patterns in terms...
Turn this exact standard into a lesson
Grade, subject, topic, and the complete standard are prefilled. Create one free, no account needed.
Also for this standard:Make a WorksheetMake a QuizMake a Sub Lesson