Alabama Math GDA.DSP.D.12.b
The Standard
- GDA.DSP.D
- Scatter plots, including plots over time, can reveal patterns, trends, clusters, and gaps that are useful in analyzing the association between two contextual variables.
- GDA.DSP.D.12
- Represent data of two quantitative variables on a scatter plot, and describe how the variables are related.
Use technology to find the least-squares line of best fit for two quantitative variables.
2019 Alabama Course of Study: Mathematics · Scatter plots, including plots over time, can reveal patterns, trends, clusters, and gaps that are useful in analyzing the association between two contextual variables.
Teacher's field guide
What This Standard Means
What Students Need to Do
- Students enter paired measurements into a spreadsheet or graphing calculator and make a scatter plot. They use the regression tool to find the least-squares line and write its equation.
What Mastery Looks Like
- Students put the input variable on the x-axis and report the equation with the correct variable labels. They use the line to make a prediction and explain what its slope means for the two measurements.
Common Misconceptions
- Some students draw a line through two convenient points and call it the least-squares line. Others swap the x and y columns or think every point must fall on the calculated line.
How to Assess It
- Exit ticket: Enter hours practiced and free throws made as (1,3), (2,5), (3,6), (4,8) in a spreadsheet. Report the regression equation and predict free throws made after 5 hours.
Lesson moves
Ways to Teach It
Enter (10,55), (20,60), (30,65), (40,72), (50,73), (60,82) as study minutes and quiz scores; graph them and display the regression equation.
Ask, "Why doesn't the least-squares line pass through every point?" Have students use one plotted point to explain a prediction error.
Partners race to enter (1,2), (2,4), (3,5), (4,7) into a spreadsheet, display its regression equation, and predict y at 5.
Give sample temperature and ice cream sales pairs (60,12), (65,16), (70,21), (75,24), (80,31); use spreadsheet regression to predict sales at 72°F.
Free download
Printable GDA.DSP.D.12.b Worksheet
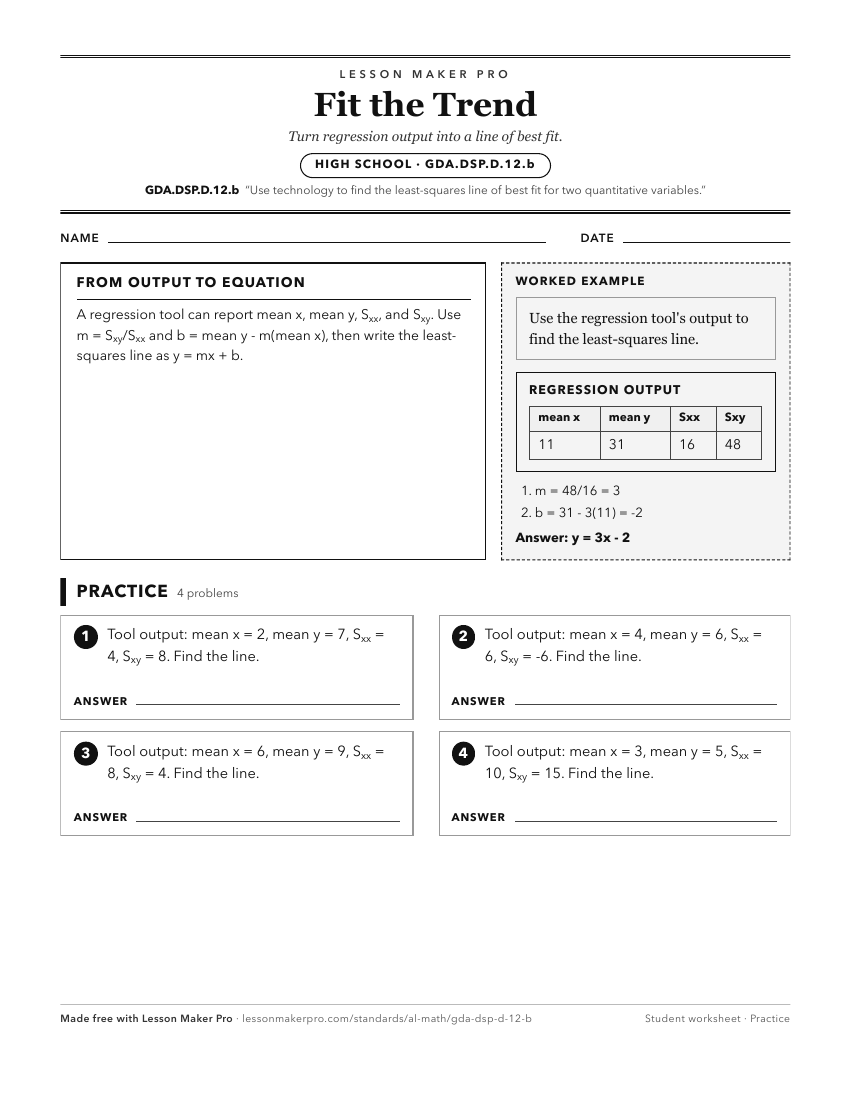
A ready-to-print activity worksheet aligned to GDA.DSP.D.12.b, with an answer key for the teacher on its own page. No account needed.
PDF, US Letter, prints cleanly in black and white.
Download the worksheetKeep exploring
Related Standards
- GDA.DSP.E
Analyzing the association between two quantitative variables should involve statistical procedures, such as examining (with technology) the sum of squared devia...
- MM.D3D.B.15
Use regression with statistical graphing technology to determine an equation that best fits a set of bivariate data, including nonlinear patterns.
Turn this exact standard into a lesson
Grade, subject, topic, and the complete standard are prefilled. Create one free, no account needed.
Also for this standard:Make a WorksheetMake a QuizMake a Sub Lesson