Alabama Math GDA.DSP.E
The Standard
Analyzing the association between two quantitative variables should involve statistical procedures, such as examining (with technology) the sum of squared deviations in fitting a linear model, analyzing residuals for patterns, generating a least-squares regression line and finding a correlation coefficient, and differentiating between correlation and causation.
2019 Alabama Course of Study: Mathematics · Geometry with Data Analysis
Teacher's field guide
What This Standard Means
What Students Need to Do
- Students plot paired numerical data and use a spreadsheet to find a least-squares line and correlation coefficient. They compare sums of squared residuals and check residual plots for patterns. They explain why association alone does not prove cause.
What Mastery Looks Like
- A student uses a regression line to predict a value within the data range. They use the correlation coefficient to describe direction and strength. They can spot a curved pattern in the residuals and say why a straight line is a poor fit.
Common Misconceptions
- Students may mistake the correlation coefficient for the line's slope. They may think a value near zero means the variables have no relationship, even when the scatterplot shows a curve. They may treat a strong correlation as proof that one variable causes the other.
How to Assess It
- Give students a spreadsheet with these (temperature, ice cream sales) pairs: (15,20), (20,28), (25,33), (30,45), (35,50). Ask for the least-squares line, correlation coefficient, sum of squared residuals, a residual plot, and one reason the data cannot prove cause.
Lesson moves
Ways to Teach It
Measure classmates' hand spans and heights, plot the pairs, then compare squared residual sums for two candidate lines in a spreadsheet.
Show a curved residual plot and ask, 'What does this pattern tell you about predictions from a straight line?'
Post four scatterplots and four correlation cards; have students match them and defend each choice using direction and strength.
Use monthly electricity bills and average temperatures to fit a line, then discuss why predictions beyond the recorded temperatures might fail.
Free download
Printable GDA.DSP.E Worksheet
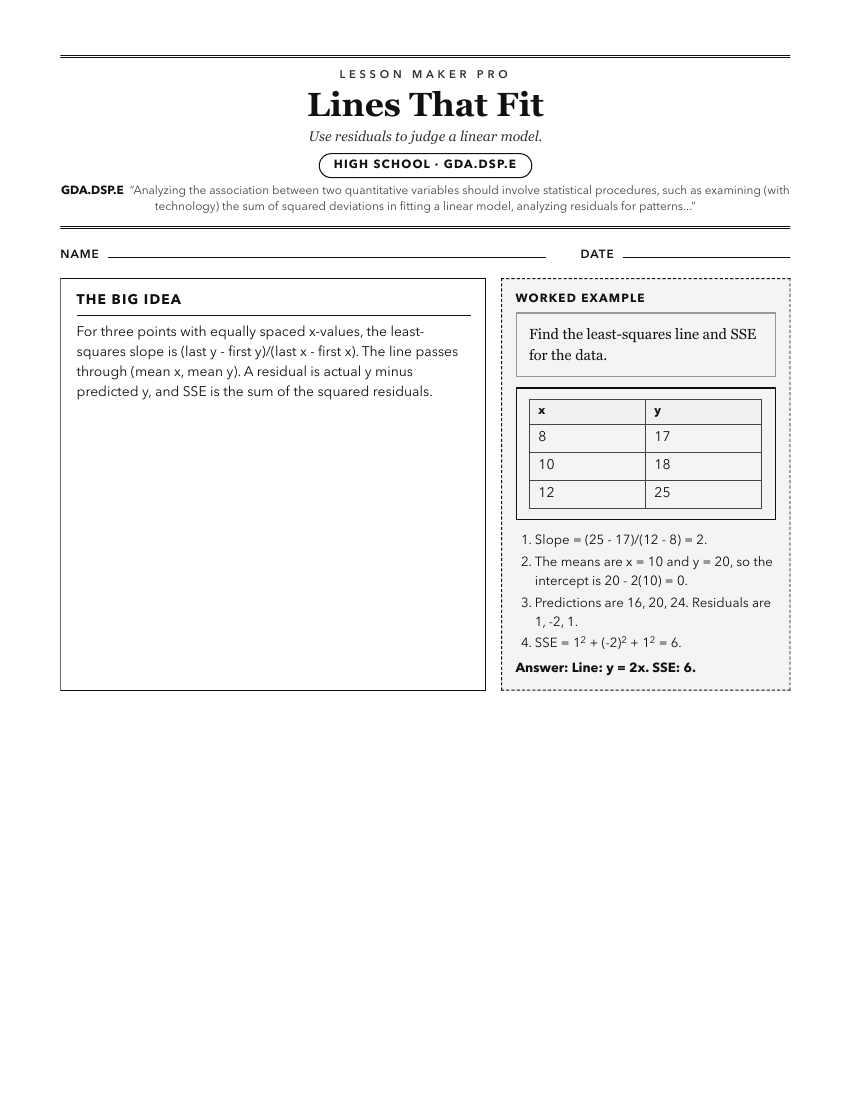
A ready-to-print activity worksheet aligned to GDA.DSP.E, with an answer key for the teacher on its own page. No account needed.
PDF, US Letter, prints cleanly in black and white.
Download the worksheetKeep exploring
Related Standards
- GDA.DSP.D.12.b
Use technology to find the least-squares line of best fit for two quantitative variables.
- GDA.DSP.A.7
Use mathematical and statistical reasoning with quantitative data, both univariate data (set of values) and bivariate data (set of pairs of values) that suggest...
- 8A.DSP.C.39
Analyze the possible association between two categorical variables.
- A1P.DSP.D.35
Analyze the possible association between two categorical variables.
Turn this exact standard into a lesson
Grade, subject, topic, and the complete standard are prefilled. Create one free, no account needed.
Also for this standard:Make a WorksheetMake a QuizMake a Sub Lesson