Wyoming Math 8.SP.4a
The Standard
Understand that patterns of association can also be seen in bivariate categorical data by displaying frequencies and relative frequencies in a two-way table. Construct and interpret a two-way table summarizing data on two categorical variables collected from the same subjects.
2023 Wyoming Mathematics Content and Performance Standards · Investigate patterns of association in bivariate data.
Teacher's field guide
What This Standard Means
What Students Need to Do
- Students put two answers from each person into a two-way table, such as travel mode and lunch choice. They calculate percentages and compare groups to look for a pattern.
What Mastery Looks Like
- A student fills in the counts and totals from paired survey answers. They use each group’s total to compare percentages and describe a pattern without claiming that one choice causes the other.
Common Misconceptions
- Students sometimes count the two answers separately and lose track of which came from the same person. They may divide by the whole class when comparing group rates, or mistake a larger count for a larger percentage.
How to Assess It
- Exit ticket: Eight students report bus and packed lunch (3), bus and bought lunch (1), walk and packed lunch (1), or walk and bought lunch (3). Make a count table, find the packed-lunch percentage for each travel group, and describe the pattern.
Lesson moves
Ways to Teach It
Give pairs 12 cards labeled bus or walk and packed or bought; have them sort the cards into four piles and make a count table.
Ask: If 12 of 20 bus riders and 3 of 10 walkers pack lunch, which group packs lunch more often? Explain with percentages.
Play table repair: give pairs a two-way table with one wrong row total and one percentage using the wrong group total; have them fix both.
Give students a mock school breakfast survey with each person's travel mode and breakfast answer; have them compare breakfast rates for bus riders and walkers.
Free download
Printable 8.SP.4a Worksheet
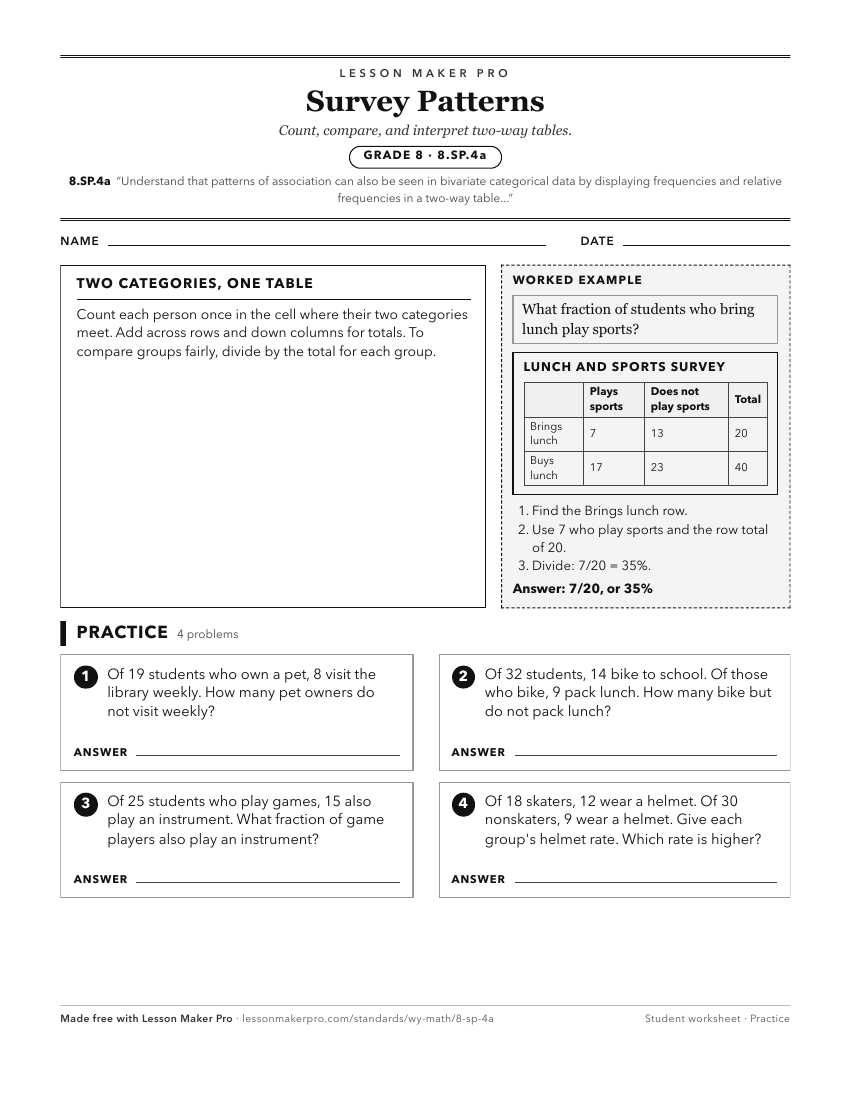
A ready-to-print activity worksheet aligned to 8.SP.4a, with an answer key for the teacher on its own page. No account needed.
PDF, US Letter, prints cleanly in black and white.
Download the worksheetKeep exploring
Related Standards
- 8.SP.4
Understand that patterns of association can also be seen in bivariate categorical data by displaying frequencies and relative frequencies in a two-way table.
- 6.SP.5
Summarize numerical data sets in relation to their real-world context.
- 8.SP.4b
Use relative frequencies calculated for rows or columns to describe possible association between the two variables.
- 7.SP.4
Given measures of center and variability (mean, median and/or mode; range, interquartile range, and/or standard deviation), for numerical data from random sampl...
Turn this exact standard into a lesson
Grade, subject, topic, and the complete standard are prefilled. Create one free, no account needed.
Also for this standard:Make a WorksheetMake a QuizMake a Sub Lesson