Wyoming Math 7.SP.4
The Standard
Given measures of center and variability (mean, median and/or mode; range, interquartile range, and/or standard deviation), for numerical data from random samples, draw appropriate informal comparative inferences about two populations.
2023 Wyoming Mathematics Content and Performance Standards · Draw informal comparative inferences about two populations.
Teacher's field guide
What This Standard Means
What Students Need to Do
- Students compare the typical values and spreads of numerical data from random samples of two groups. They use the sample summaries to say what may be true of the larger groups, without claiming certainty.
What Mastery Looks Like
- Given sample medians of 8 and 12 and IQRs of 4 and 7, a student says the second population likely has a higher typical value. They note that the second sample has a wider middle half and that another random sample could give different results.
Common Misconceptions
- Students may compare medians while ignoring a much larger IQR. They may treat sample results as exact facts about both populations or assume a higher median means every value is higher.
How to Assess It
- Exit ticket: Two random samples of quiz scores have A: median 14, IQR 2 and B: median 17, IQR 6. Which population likely scores higher, which sample varies more, and why is your claim uncertain?
Lesson moves
Ways to Teach It
Put slips numbered 1 to 20 in one bag and 6 to 25 in another; draw 10 from each and compare medians and IQRs.
Post medians of 12 and 15 and IQRs of 3 and 9, then ask which group likely scores higher and how certain students are.
Make three random-sample cards: median 10, IQR 2; median 14, IQR 5; median 18, IQR 8; draw pairs and compare populations.
Give sampled bus wait summaries: Route A, median 8 minutes, IQR 4; Route B, median 12, IQR 7; recommend a route.
Free download
Printable 7.SP.4 Worksheet
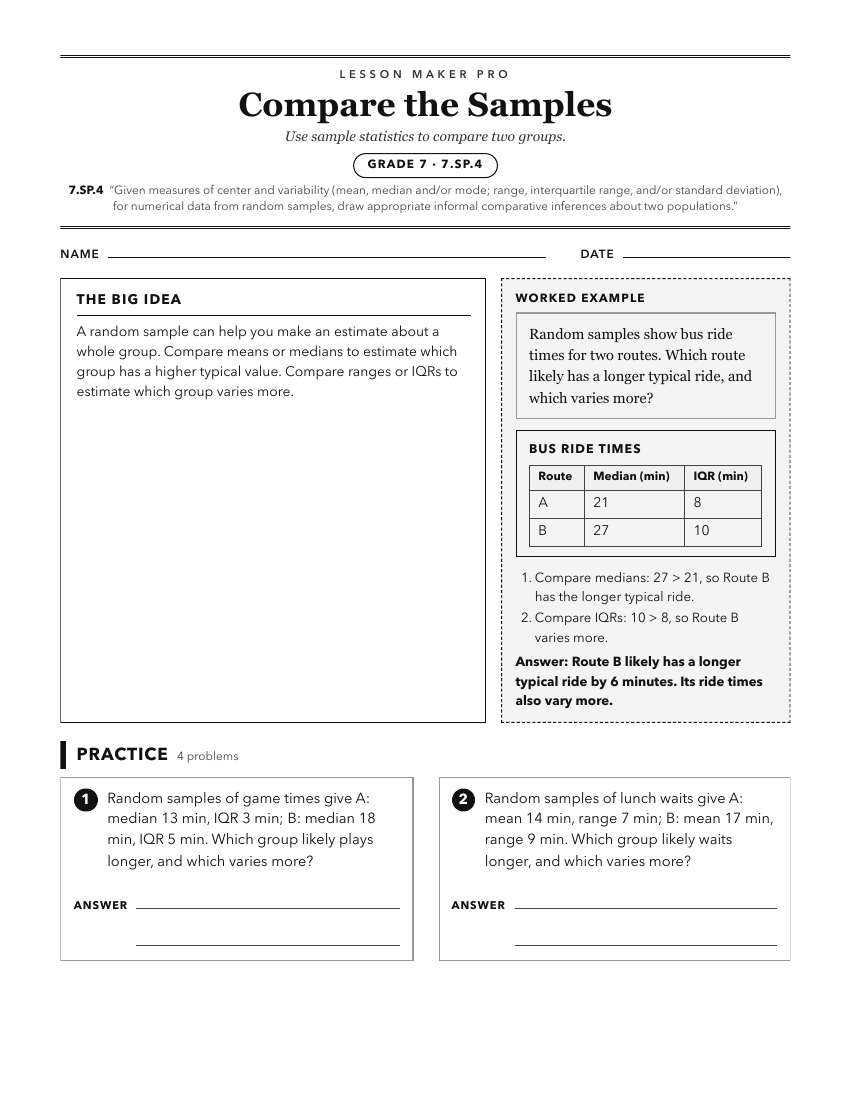
A ready-to-print activity worksheet aligned to 7.SP.4, with an answer key for the teacher on its own page. No account needed.
PDF, US Letter, prints cleanly in black and white.
Download the worksheetKeep exploring
Related Standards
- 6.SP.5d
Justify the choice of measures of center (median, mode, or mean) based on the shape of the data distribution and the context in which the data was gathered.
- 6.SP.5c
Find quantitative measures of center (median, mode and mean) and variability (range and interquartile range). Describe any overall pattern (including outliers, ...
- 6.SP.5
Summarize numerical data sets in relation to their real-world context.
- 8.SP.4b
Use relative frequencies calculated for rows or columns to describe possible association between the two variables.
Turn this exact standard into a lesson
Grade, subject, topic, and the complete standard are prefilled. Create one free, no account needed.
Also for this standard:Make a WorksheetMake a QuizMake a Sub Lesson