Wyoming Math 6.SP.5c
The Standard
Summarize numerical data sets in relation to their real-world context. Find quantitative measures of center (median, mode and mean) and variability (range and interquartile range). Describe any overall pattern (including outliers, clusters, and distribution), with reference to the context in which the data was gathered.
2023 Wyoming Mathematics Content and Performance Standards · Summarize and describe distributions.
Teacher's field guide
What This Standard Means
What Students Need to Do
- Students find the mean, median, mode, range, and interquartile range of a data set. They describe where values cluster, whether values tend to be high or low, and whether any value stands apart. They explain what those patterns mean in the situation measured.
What Mastery Looks Like
- A student calculates all five measures correctly from a short data set and identifies its clusters and outliers. They use the data's units to explain why the median may describe a typical value better than the mean when one value is extreme.
Common Misconceptions
- Students may choose the middle value without sorting first, or report only one mode when two values tie. They may use the full range instead of subtracting the first quartile from the third. They may treat the mean as typical even when an outlier pulls it away from most values.
How to Assess It
- Eight students spent 2, 3, 3, 4, 5, 5, 6, and 20 minutes walking to school. Find the mean, median, mode, range, and IQR, then describe the cluster and outlier in walking times.
Lesson moves
Ways to Teach It
Give pairs paper strips cut to 2, 3, 3, 4, 5, 5, 6, and 12 centimeters; have them measure, sort, and find quartiles.
Ask, "If seven bus rides take 8 to 12 minutes and one takes 40, which better describes a usual ride, mean or median? Why?"
Play a card race: give pairs the data sets 1, 2, 2, 3 and 1, 1, 3, 7; have them find each mean and IQR.
Give students a grocery receipt with eight item prices; have them find the median price and explain whether one costly item shifts the mean.
Free download
Printable 6.SP.5c Worksheet
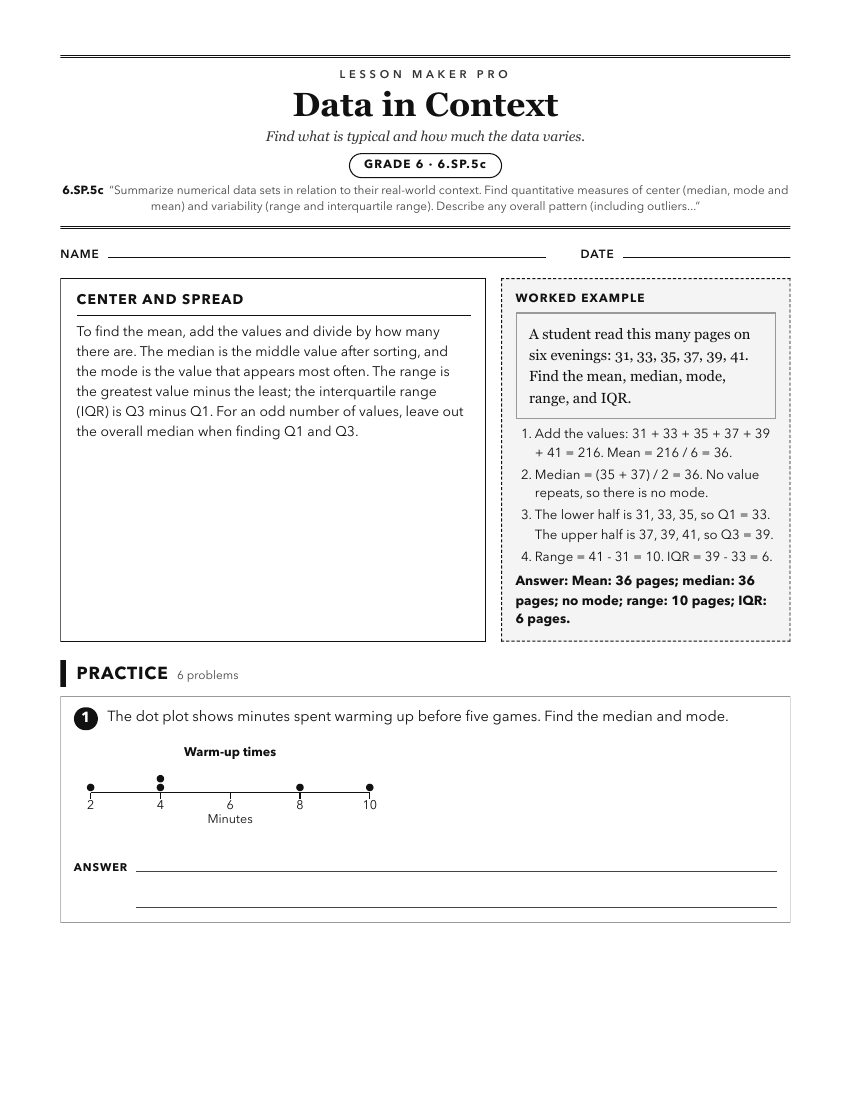
A ready-to-print activity worksheet aligned to 6.SP.5c, with an answer key for the teacher on its own page. No account needed.
PDF, US Letter, prints cleanly in black and white.
Download the worksheetKeep exploring
Related Standards
- 6.SP.4
Display numerical data in plots on a number line, including dot plots, stem-and-leaf plots, histograms, and box plots.
- 6.SP.5d
Justify the choice of measures of center (median, mode, or mean) based on the shape of the data distribution and the context in which the data was gathered.
- 6.SP.5
Summarize numerical data sets in relation to their real-world context.
- 7.SP.4
Given measures of center and variability (mean, median and/or mode; range, interquartile range, and/or standard deviation), for numerical data from random sampl...
Turn this exact standard into a lesson
Grade, subject, topic, and the complete standard are prefilled. Create one free, no account needed.
Also for this standard:Make a WorksheetMake a QuizMake a Sub Lesson