Wyoming Math 6.SP.5d
The Standard
Summarize numerical data sets in relation to their real-world context. Justify the choice of measures of center (median, mode, or mean) based on the shape of the data distribution and the context in which the data was gathered.
2023 Wyoming Mathematics Content and Performance Standards · Summarize and describe distributions.
Teacher's field guide
What This Standard Means
What Students Need to Do
- Students find the mean, median, and mode of a numerical data set and look at its shape. They choose a measure that fits the real-world question and explain their choice.
What Mastery Looks Like
- Students calculate all three measures correctly. They can explain why an outlier makes the mean less useful for describing a typical value. They choose the mode when the most frequent value answers the question.
Common Misconceptions
- Students may call the mean typical even when one high value pulls it up. Some choose the mode when no value repeats. Others confuse the median with the number halfway between the lowest and highest values.
How to Assess It
- Exit ticket: Commute times are 5, 6, 7, 8, 9, 10, 11, 12, and 60 minutes. Find the mean and median, then choose which better describes a typical commute and explain why.
Lesson moves
Ways to Teach It
Have pairs plot commute times 5, 6, 7, 8, 9, 10, 11, 12, 60 with sticky notes and mark the mean and median.
Ask students to write: Which measure better describes a typical commute in our plot, and how does the 60-minute trip affect your choice?
Teams match mean, median, or mode to quiz scores 7, 8, 9; rents 800, 900, 4000; and shoe sizes 6, 7, 7 for stocking.
Compare five advertised apartment rents from a local listing page; students choose a typical rent and explain how one expensive listing changes the mean.
Free download
Printable 6.SP.5d Worksheet
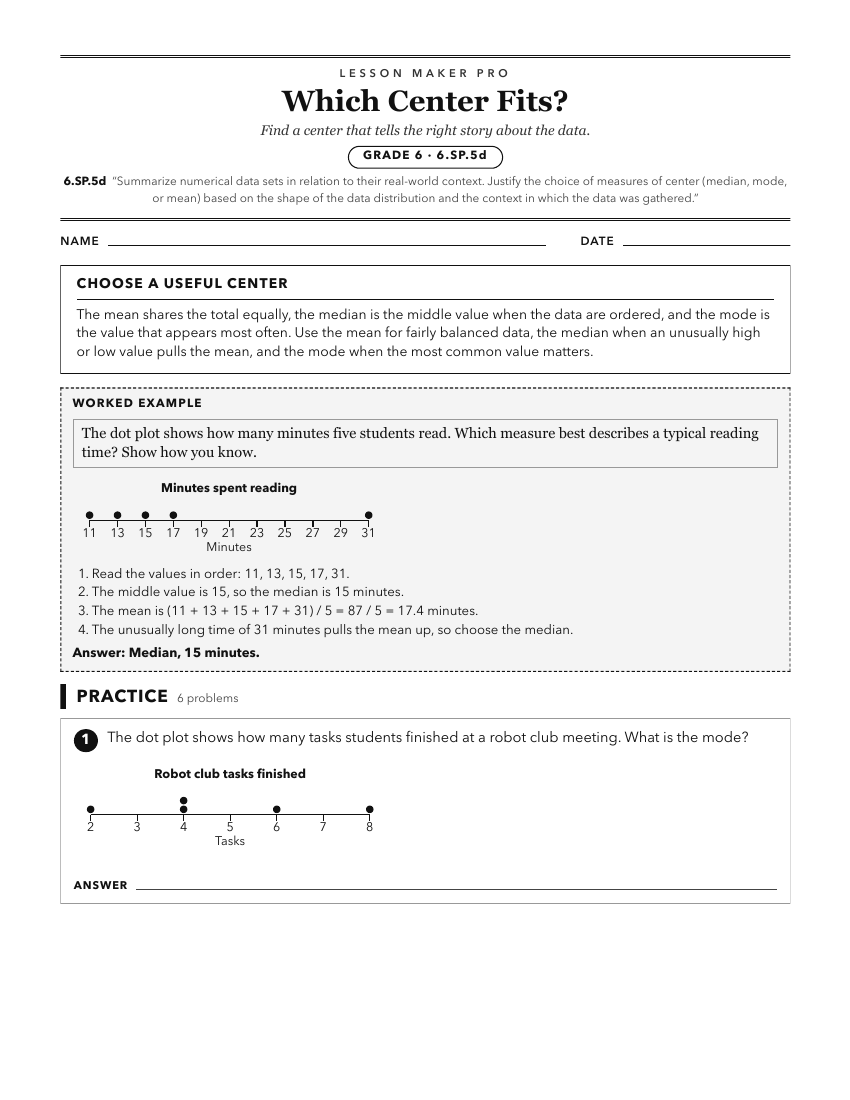
A ready-to-print activity worksheet aligned to 6.SP.5d, with an answer key for the teacher on its own page. No account needed.
PDF, US Letter, prints cleanly in black and white.
Download the worksheetKeep exploring
Related Standards
- 6.SP.5c
Find quantitative measures of center (median, mode and mean) and variability (range and interquartile range). Describe any overall pattern (including outliers, ...
- 6.SP.5
Summarize numerical data sets in relation to their real-world context.
- 7.SP.4
Given measures of center and variability (mean, median and/or mode; range, interquartile range, and/or standard deviation), for numerical data from random sampl...
- 6.SP.5b
Describe the context of the data under investigation, including how it was measured and its units of measurement.
Turn this exact standard into a lesson
Grade, subject, topic, and the complete standard are prefilled. Create one free, no account needed.
Also for this standard:Make a WorksheetMake a QuizMake a Sub Lesson