Wyoming Math 6.SP.5
Standard Cluster
Summarize numerical data sets in relation to their real-world context. Report the sample size. Describe the context of the data under investigation, including how it was measured and its units of measurement. Find quantitative measures of center (median, mode and mean) and variability (range and interquartile range). Describe any overall pattern (including outliers, clusters, and distribution), with reference to the context in which the data was gathered. Justify the choice of measures of center (median, mode, or mean) based on the shape of the data distribution and the context in which the data was gathered.
2023 Wyoming Mathematics Content and Performance Standards · Summarize and describe distributions.
Cluster contents
Standards in This Cluster
6.SP.5 is a cluster heading. These are the individual standards under it.
- 6.SP.5b
Describe the context of the data under investigation, including how it was measured and its units of measurement.
- 6.SP.5c
Find quantitative measures of center (median, mode and mean) and variability (range and interquartile range). Describe any overall pattern (including outliers, ...
- 6.SP.5d
Justify the choice of measures of center (median, mode, or mean) based on the shape of the data distribution and the context in which the data was gathered.
Teacher's field guide
What This Cluster Means
What Students Need to Do
- Students report how many values are in a data set, what was measured, and the units. They find the mean, median, mode, range, and interquartile range. They describe clusters, outliers, and the shape of the data, then choose a center that fits the context.
What Mastery Looks Like
- A student can make a dot plot of walk times, calculate the measures correctly, and describe where most times fall. They can explain why the median describes a typical walk better than the mean when one walk takes much longer than the rest.
Common Misconceptions
- Students may confuse the sample size with the sum of the values or leave units off their answers. They may subtract the smallest value from the largest to find interquartile range, or choose the mean without checking for an outlier.
How to Assess It
- Exit ticket: Eight students timed their walks to school in minutes: 4, 5, 5, 5, 6, 7, 8, 24. Report the sample size, mean, median, mode, range, and interquartile range; identify the cluster and outlier, and explain which center best describes a typical walk.
Lesson moves
Ways to Teach It
Measure ten classroom objects in centimeters, put each length on a sticky-note dot plot, and calculate the median and interquartile range.
Display walk times of 4, 5, 5, 5, 6, 7, 8, and 24 minutes; ask which center best represents a typical walk.
Deal eight number cards per group; students build dot plots, swap plots, and check each other's mean, median, mode, range, and interquartile range.
Copy seven local daily high temperatures, note degrees Fahrenheit, and compare mean and median after raising one day's high by 30 degrees.
Free download
Printable 6.SP.5 Worksheet
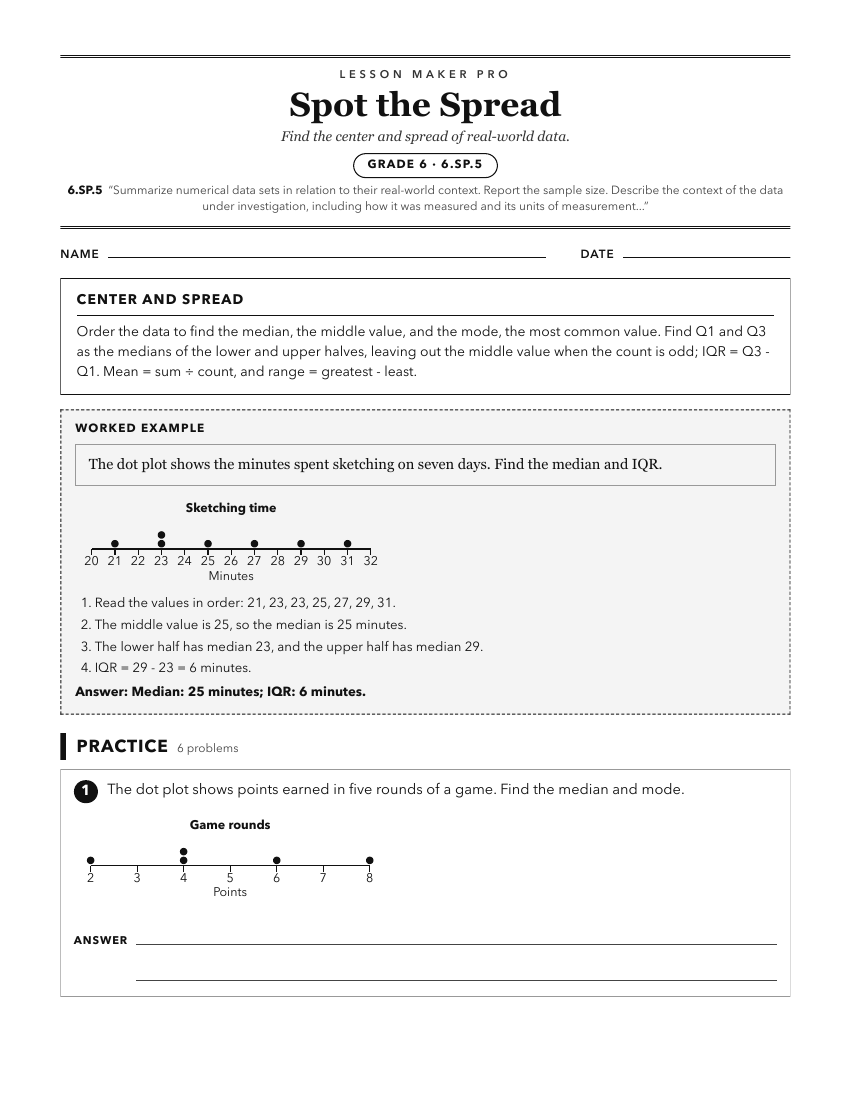
A ready-to-print activity worksheet aligned to 6.SP.5, with an answer key for the teacher on its own page. No account needed.
PDF, US Letter, prints cleanly in black and white.
Download the worksheetKeep exploring
Related Standards
Turn this cluster into a lesson
Grade, subject, topic, and the complete cluster are prefilled. Create one free, no account needed.
Also for this cluster:Make a WorksheetMake a QuizMake a Sub Lesson