Wyoming Math 6.SP.5b
The Standard
Summarize numerical data sets in relation to their real-world context. Describe the context of the data under investigation, including how it was measured and its units of measurement.
2023 Wyoming Mathematics Content and Performance Standards · Summarize and describe distributions.
Teacher's field guide
What This Standard Means
What Students Need to Do
- Students describe who or what a data set is about and what each number measures. They explain how the data was measured and name its units, such as centimeters or seconds.
What Mastery Looks Like
- Given a table of bus ride times, a student can say whose rides were timed, what the start and end points were, and that the values are in minutes. If the measuring method is not given, they say so instead of guessing.
Common Misconceptions
- Students may call bus ride times a count of students rather than minutes per ride. They may leave off units or claim a tool was used when the source does not say how the data was measured.
How to Assess It
- Give students this prompt: “Five walks from the classroom door to the cafeteria were timed with a stopwatch: 42, 45, 47, 50, and 51 seconds. What does each number record, how was it measured, and what is its unit?”
Lesson moves
Ways to Teach It
Measure three pencils from tip to end with a ruler, then label each length in centimeters and describe the measuring method.
Post 12, 15, 18 and ask: “Could these be pencil lengths or race times? What else must we know?”
Match cards showing pencil lengths, sprint times, and water volumes to ruler, stopwatch, or measuring cup cards labeled centimeters, seconds, and milliliters.
Show a printed rainfall log for your town and a rain gauge photo; ask students to name the place, measurement, tool, and units.
Free download
Printable 6.SP.5b Worksheet
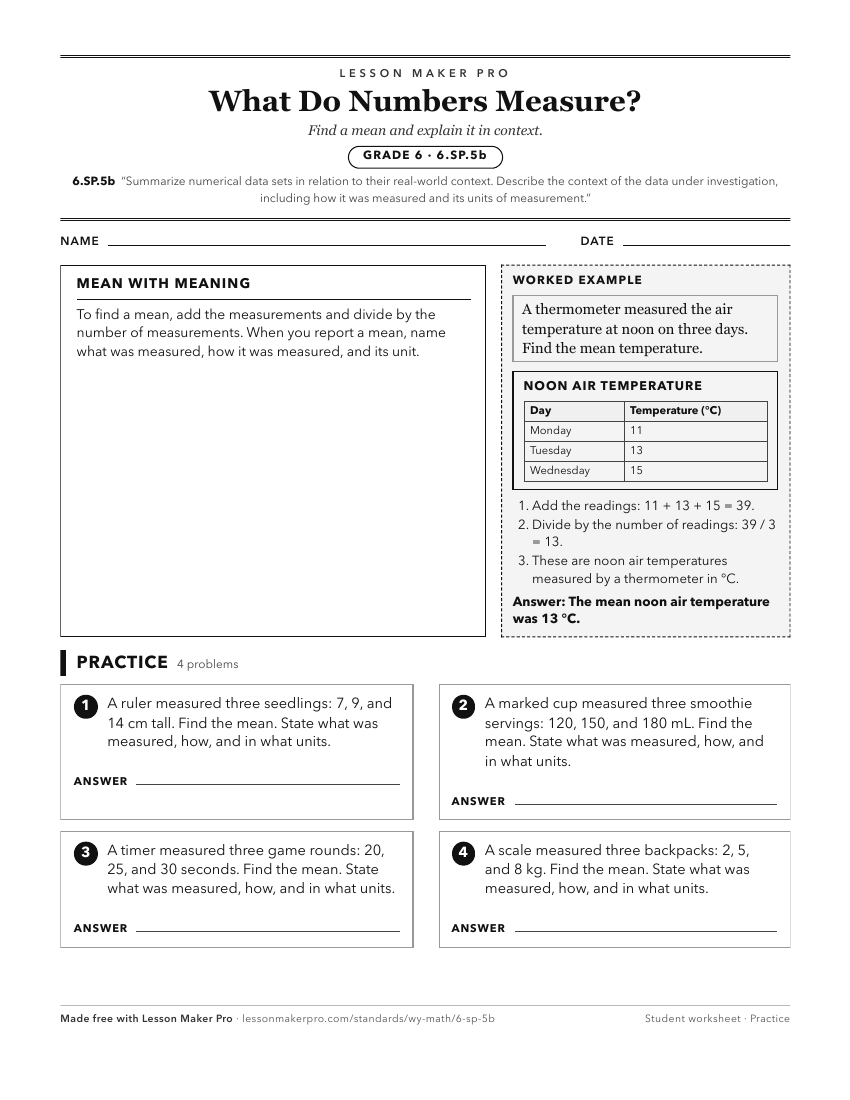
A ready-to-print activity worksheet aligned to 6.SP.5b, with an answer key for the teacher on its own page. No account needed.
PDF, US Letter, prints cleanly in black and white.
Download the worksheetKeep exploring
Related Standards
- 6.SP.5d
Justify the choice of measures of center (median, mode, or mean) based on the shape of the data distribution and the context in which the data was gathered.
- 6.SP.5c
Find quantitative measures of center (median, mode and mean) and variability (range and interquartile range). Describe any overall pattern (including outliers, ...
- 6.SP.5
Summarize numerical data sets in relation to their real-world context.
Turn this exact standard into a lesson
Grade, subject, topic, and the complete standard are prefilled. Create one free, no account needed.
Also for this standard:Make a WorksheetMake a QuizMake a Sub Lesson