Wyoming Math 8.SP.4
Standard Cluster
Understand that patterns of association can also be seen in bivariate categorical data by displaying frequencies and relative frequencies in a two-way table. Construct and interpret a two-way table summarizing data on two categorical variables collected from the same subjects. Use relative frequencies calculated for rows or columns to describe possible association between the two variables.
2023 Wyoming Mathematics Content and Performance Standards · Investigate patterns of association in bivariate data.
Cluster contents
Standards in This Cluster
8.SP.4 is a cluster heading. These are the individual standards under it.
Teacher's field guide
What This Cluster Means
What Students Need to Do
- Record two answers from each person in a two-way table. Calculate percentages within rows or columns, then compare groups to look for a possible association.
What Mastery Looks Like
- A student puts each person's paired answers in one cell and totals the rows and columns. They use the right group total to find each percentage and describe the difference without claiming one answer caused the other.
Common Misconceptions
- Students may compare raw counts even when the groups are different sizes. They may divide by the total number of people instead of a row or column total, or mistake an association for proof of cause.
How to Assess It
- Exit ticket: Of 20 bus riders, 12 packed lunch. Of 10 nonriders, 3 packed lunch. Build a two-way table, find the packed-lunch percentage for each group, and describe any association.
Lesson moves
Ways to Teach It
Ask classmates whether they rode the bus and packed lunch today; place each person's paired answers in one cell of a four-cell table.
Ask: If 60% of bus riders and 30% of nonriders packed lunch, what association do you see, and what can't you conclude?
Pairs race to sort 16 bus-and-lunch cards into a two-way table, then compare packed-lunch percentages for bus riders and nonriders.
Give students a mock cafeteria roster marked by grade and packed lunch yes/no; compare rates by grade to plan lunch orders.
Free download
Printable 8.SP.4 Worksheet
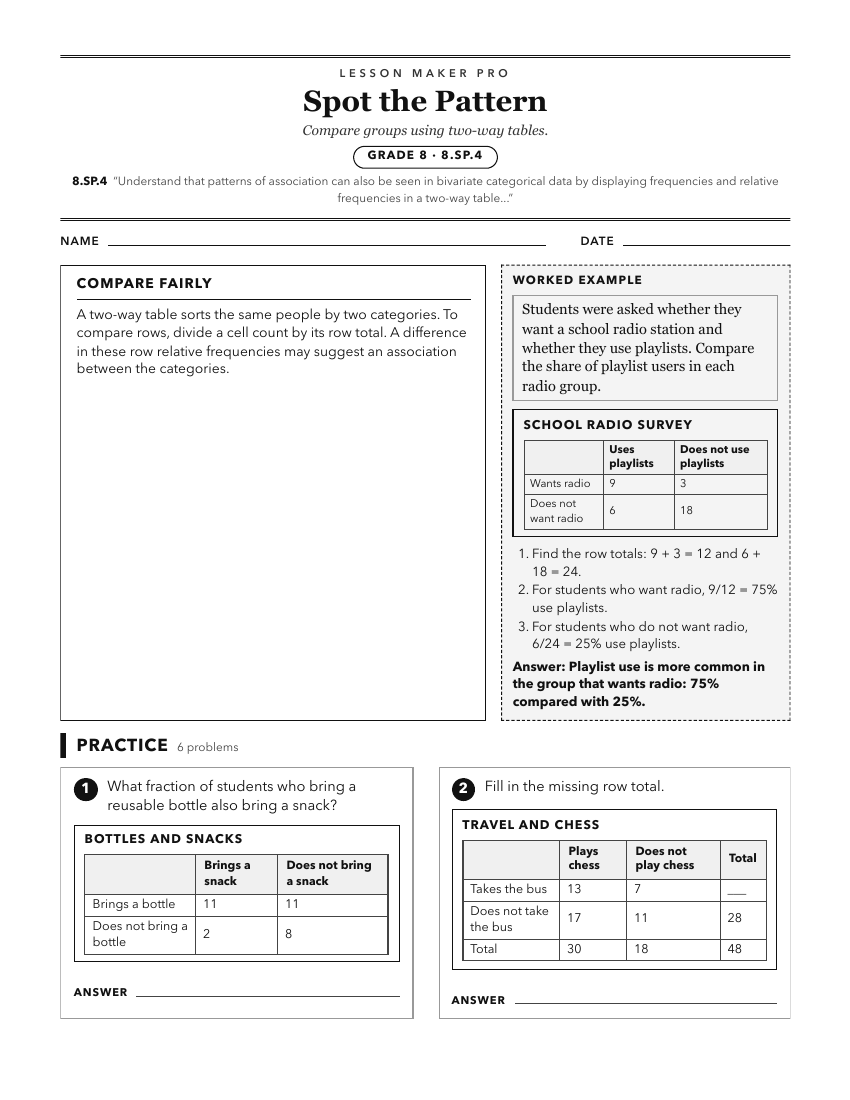
A ready-to-print activity worksheet aligned to 8.SP.4, with an answer key for the teacher on its own page. No account needed.
PDF, US Letter, prints cleanly in black and white.
Download the worksheetKeep exploring
Related Standards
- 6.SP.5c
Find quantitative measures of center (median, mode and mean) and variability (range and interquartile range). Describe any overall pattern (including outliers, ...
- 7.SP.4
Given measures of center and variability (mean, median and/or mode; range, interquartile range, and/or standard deviation), for numerical data from random sampl...
Turn this cluster into a lesson
Grade, subject, topic, and the complete cluster are prefilled. Create one free, no account needed.
Also for this cluster:Make a WorksheetMake a QuizMake a Sub Lesson