Wyoming Math 7.SP.6
The Standard
Collect multiple samples to compare the relationship between theoretical and experimental probabilities for simple events.
2023 Wyoming Mathematics Content and Performance Standards · Investigate chance processes and develop, use, and evaluate probability models.
Teacher's field guide
What This Standard Means
What Students Need to Do
- Students find the predicted chance of a simple event, such as rolling a six on a fair die. They run several separate sets of trials, find the fraction of sixes in each set, and compare those fractions with 1/6.
What Mastery Looks Like
- A student can calculate the fraction of sixes in each of three sets of rolls. They can identify which results are closest to 1/6 and explain why the sets do not have to match.
Common Misconceptions
- Some students expect exactly one six in every six rolls. Others divide by six instead of the number of rolls, or think a round with few sixes changes the chance of rolling one.
How to Assess It
- Exit ticket: A fair die shows six 3, 5, and 1 times in three separate sets of 18 rolls. Find the fraction for each set and circle the one closest to 1/6.
Lesson moves
Ways to Teach It
Give pairs a fair die and a tally sheet; have them roll three separate sets of 24, recording sixes and comparing each fraction with 1/6.
Write: Two groups each roll a die 24 times and get two and seven sixes. Does either result prove the die is unfair? Why?
Deal cards showing 12-roll samples with one, two, or four sixes; pairs race to order the results by closeness to 1/6.
Show a prize wheel with four equal sections, one labeled prize; compare rates from three 20-spin rounds with 3, 6, and 4 wins to 1/4.
Free download
Printable 7.SP.6 Worksheet
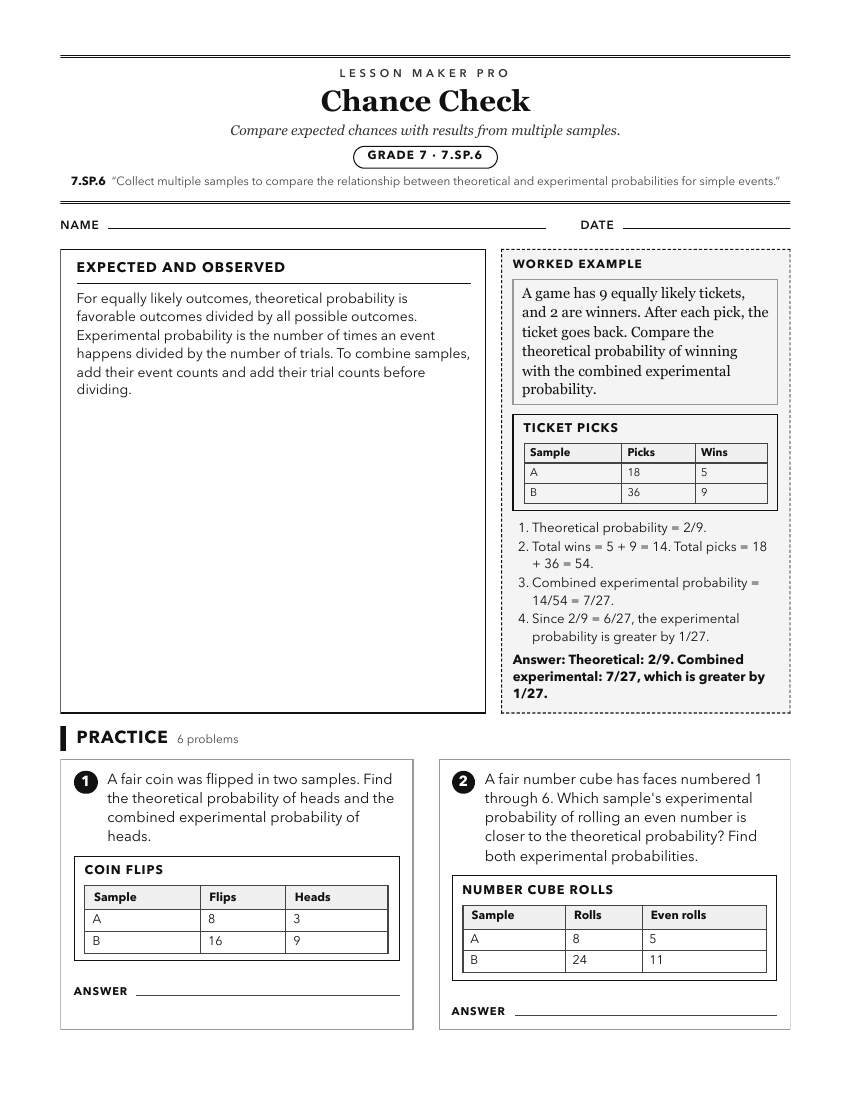
A ready-to-print activity worksheet aligned to 7.SP.6, with an answer key for the teacher on its own page. No account needed.
PDF, US Letter, prints cleanly in black and white.
Download the worksheetKeep exploring
Related Standards
- 7.SP.5
Find and interpret the probability of a random event. Understand that the probability of a random event is a number between, and including, 0 and 1 that express...
- 7.SP.1b
Differentiate between random and non-random sampling.
- 8.SP.4b
Use relative frequencies calculated for rows or columns to describe possible association between the two variables.
- 7.SP.4
Given measures of center and variability (mean, median and/or mode; range, interquartile range, and/or standard deviation), for numerical data from random sampl...
Turn this exact standard into a lesson
Grade, subject, topic, and the complete standard are prefilled. Create one free, no account needed.
Also for this standard:Make a WorksheetMake a QuizMake a Sub Lesson