Wyoming Math 7.SP.1b
The Standard
Solve real-world and mathematical problems involving: Differentiate between random and non-random sampling.
2023 Wyoming Mathematics Content and Performance Standards · Use random sampling to draw inferences about a population.
Teacher's field guide
What This Standard Means
What Students Need to Do
- Students tell whether people were picked by chance from the whole group or chosen because they were nearby, known, or willing. They explain why the choice matters for a survey result.
What Mastery Looks Like
- Given a school survey plan, students can say who had a chance to be picked and who did not. They can explain why drawing names from one class is not a random sample of the whole school. They can fix the plan by drawing from the full school roster.
Common Misconceptions
- Students may call a hallway survey random because they asked whoever walked by. They may think a large volunteer survey is random, or that a random sample must match the whole group exactly.
How to Assess It
- Exit ticket: Maya draws 20 names from the full student roster. Leo asks 20 friends at lunch. Which sample is random, and why?
Lesson moves
Ways to Teach It
Put each student's name on a slip, draw five from a cup, then compare with choosing the five seats nearest the door.
Ask: Would surveying the first 30 people at a school game tell us what all students think? Who might be missing?
Give pairs cards showing a school roster draw, friend poll, hallway poll, and volunteer form; have them sort random from nonrandom.
Show a lunch-line poll about school meal changes; ask students to plan a random sample of all students using the school roster.
Free download
Printable 7.SP.1b Worksheet
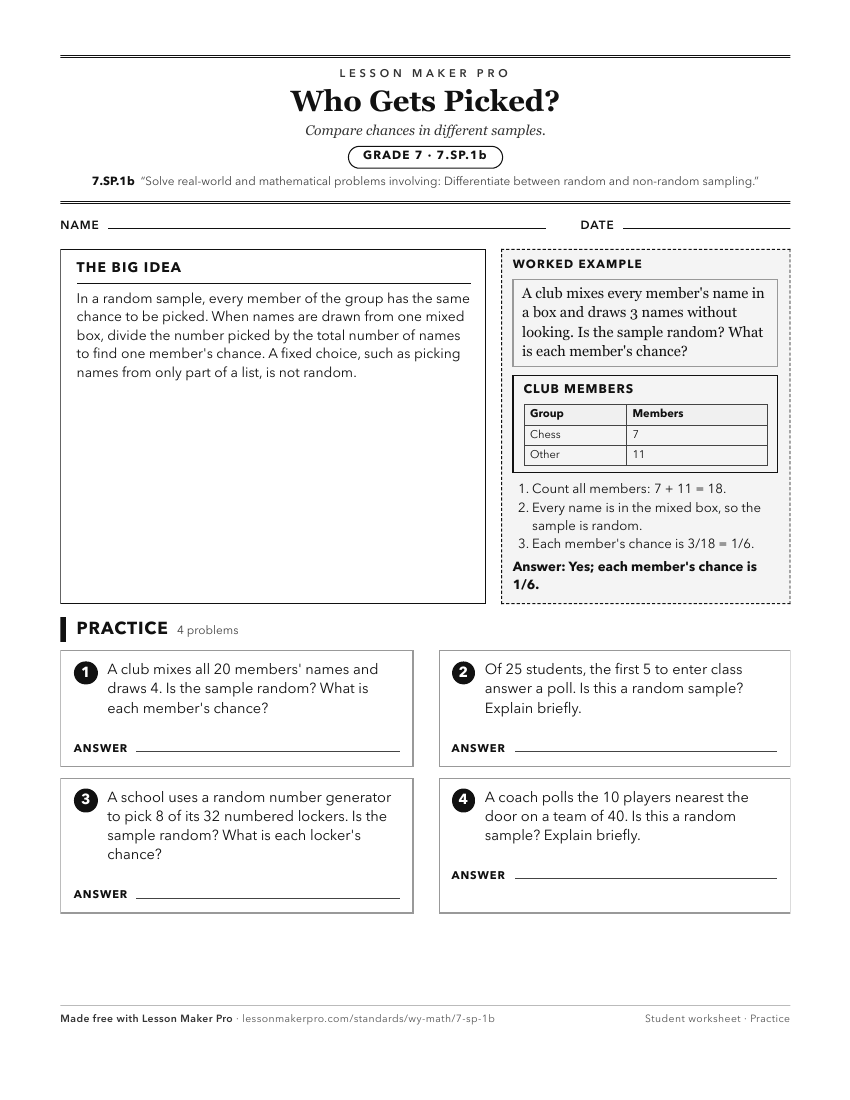
A ready-to-print activity worksheet aligned to 7.SP.1b, with an answer key for the teacher on its own page. No account needed.
PDF, US Letter, prints cleanly in black and white.
Download the worksheetKeep exploring
Related Standards
- 7.SP.1d
Understand that random sampling is used to gather a representative sample and tends to support valid inferences about the population.
- 7.SP.6
Collect multiple samples to compare the relationship between theoretical and experimental probabilities for simple events.
- 7.SP.4
Given measures of center and variability (mean, median and/or mode; range, interquartile range, and/or standard deviation), for numerical data from random sampl...
- 7.SP.1a
Understand that a sample is a subset of a population.
Turn this exact standard into a lesson
Grade, subject, topic, and the complete standard are prefilled. Create one free, no account needed.
Also for this standard:Make a WorksheetMake a QuizMake a Sub Lesson