Virginia SOL LS.1.c.i
The Standard
- LS.1
- The student will demonstrate an understanding of scientific and engineering practices by
interpreting, analyzing, and evaluating data identify, interpret, and evaluate patterns in data
Virginia Standards of Learning for Science · The student will demonstrate an understanding of scientific and engineering practices by
Teacher's field guide
What This Standard Means
What Students Need to Do
- Students examine tables, graphs, and recorded observations. They describe trends, compare groups, spot outliers, and decide whether the evidence supports a claim.
What Mastery Looks Like
- Students state a pattern using specific values from the data. They explain unusual results and avoid making claims that go beyond the evidence.
Common Misconceptions
- Students may describe single data points instead of the overall trend. They may ignore outliers, confuse correlation with cause, or treat a small difference as meaningful.
How to Assess It
- Give students plant growth data of 2, 5, 8, and 7 centimeters under increasing light levels. Ask them to describe the pattern, note the drop from 8 to 7 centimeters at the highest light level, and support a claim with two values.
Lesson moves
Ways to Teach It
Have pairs measure ten leaves, graph leaf length, and describe the pattern and any outliers.
Ask students to write whether warmer water causes faster fish breathing, using only evidence from a provided data table.
Give groups graph cards and claim cards, then have them match each claim to supporting data or reject it.
Show local mosquito counts and rainfall totals, then ask students to describe the relationship without claiming rainfall directly caused the change.
Free download
Printable LS.1.c.i Worksheet
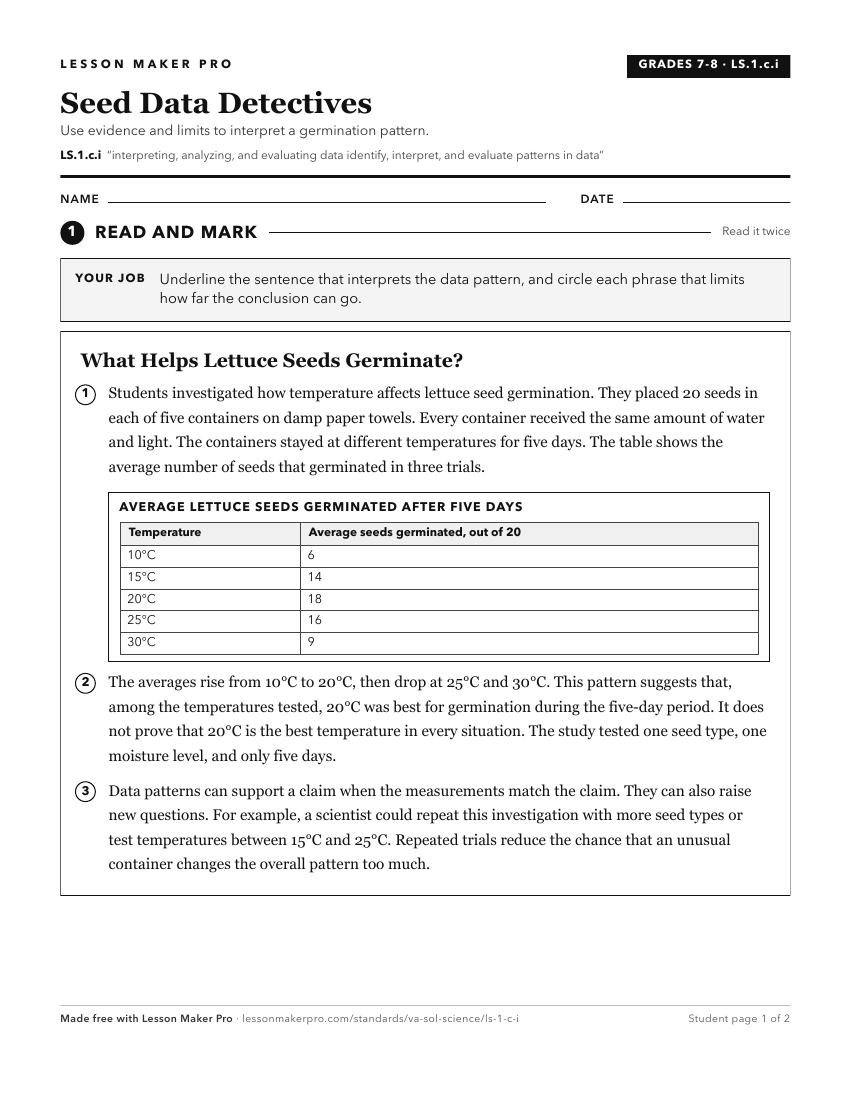
A ready-to-print activity worksheet aligned to LS.1.c.i, with an answer key for the teacher on its own page. No account needed.
PDF, US Letter, prints cleanly in black and white.
Download the worksheetKeep exploring
Related Standards
Turn this exact standard into a lesson
Grade, subject, topic, and the complete standard are prefilled. Create one free, no account needed.
Also for this standard:Make a WorksheetMake a QuizMake a Sub Lesson