Virginia SOL 7.PFA.1
SOL Standard (Knowledge and Skills Cluster)
The student will investigate and analyze proportional relationships between two quantities using verbal descriptions, tables, equations in y = mx form, and graphs, including problems in context.
Virginia Standards of Learning for Mathematics
Cluster contents
Knowledge and Skills in This Standard
7.PFA.1 is a Standards of Learning standard. These are the knowledge and skills expectations under it.
- 7.PFA.1.a
Determine the slope, m, as the rate of change in a proportional relationship between two quantities given a table of values, graph, or contextual situation and ...
- 7.PFA.1.b
Identify and describe a line with a slope that is positive, negative, or zero (0), given a graph.
- 7.PFA.1.c
Graph a line representing a proportional relationship, between two quantities given an ordered pair on the line and the slope, m, as rate of change. Slope may i...
- 7.PFA.1.d
Graph a line representing a proportional relationship between two quantities given the equation of the line in the form y = mx, where m represents the slope as ...
- 7.PFA.1.e
Make connections between and among representations of a proportional relationship between two quantities using problems in context, tables, equations, and graph...
Teacher's field guide
What This Cluster Means
What Students Need to Do
- Students find the constant rate linking two quantities in tables, graphs, and situations. They write y = mx and graph the relationship from an equation or from a point and slope. They connect representations and identify positive, negative, and zero slope.
What Mastery Looks Like
- Given any representation, a student finds the same value of m and explains it as change in y per unit of x. The student writes an equation, graphs a line through the origin, and checks that given points fit. The student correctly names the slope sign from a graph.
Common Misconceptions
- Students often treat a proportional pattern as additive, write y = mx + b, or graph a line that misses the origin. They may reverse rise and run, miss a negative sign, or confuse zero slope with an undefined slope.
How to Assess It
- Exit ticket: Use the table x: 0, 2, 4 and y: 0, -3, -6. Find m, write y = mx, sketch the line, and label its slope as positive, negative, or zero.
Lesson moves
Ways to Teach It
Tape a coordinate grid on the floor; students use slope cards to walk from the origin and mark three points with sticky notes.
Ask students to explain in writing how moving left to right reveals positive, negative, or zero slope on three displayed graphs.
Run a card sort matching situation, table, equation, and graph cards, then have partners justify each set using the constant rate.
Use grocery prices to build a cost table, calculate price per pound, write an equation, and graph total cost.
Free download
Printable 7.PFA.1 Worksheet
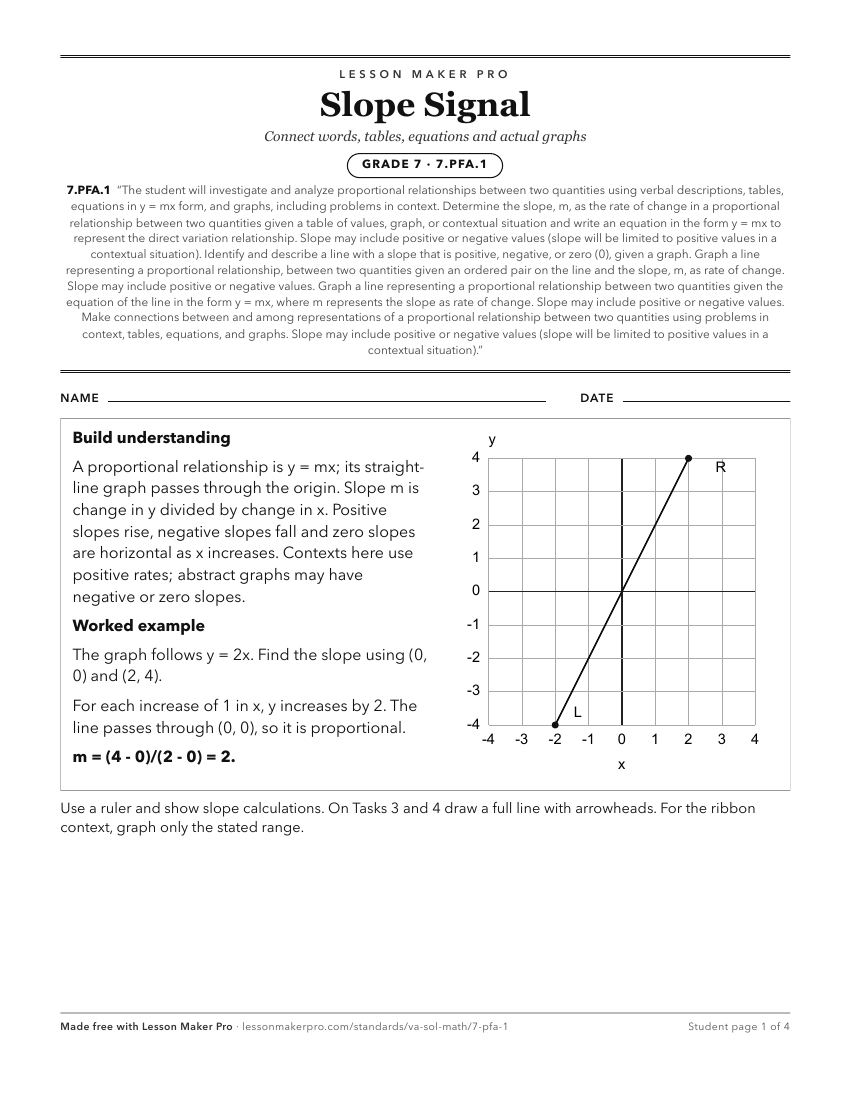
A ready-to-print activity worksheet aligned to 7.PFA.1, with an answer key for the teacher on its own page. No account needed.
PDF, US Letter, prints cleanly in black and white.
Download the worksheetKeep exploring
Related Standards
- 7.MG.2
The student will solve problems and justify relationships of similarity using proportional reasoning.
- 6.PFA.2
The student will identify and represent proportional relationships between two quantities, including those in context (unit rates are limited to positive values...
- 6.PFA.1
The student will use ratios to represent relationships between quantities, including those in context.
- 7.CE.2
The student will solve problems, including those in context, involving proportional relationships.
Turn this cluster into a lesson
Grade, subject, topic, and the complete cluster are prefilled. Create one free, no account needed.
Also for this cluster:Make a WorksheetMake a QuizMake a Sub Lesson