Virginia SOL 6.PFA.2
SOL Standard (Knowledge and Skills Cluster)
The student will identify and represent proportional relationships between two quantities, including those in context (unit rates are limited to positive values).
Virginia Standards of Learning for Mathematics
Cluster contents
Knowledge and Skills in This Standard
6.PFA.2 is a Standards of Learning standard. These are the knowledge and skills expectations under it.
- 6.PFA.2.a
Identify the unit rate of a proportional relationship represented by a table of values, a contextual situation, or a graph.
- 6.PFA.2.b
Determine a missing value in a ratio table that represents a proportional relationship between two quantities using a unit rate.
- 6.PFA.2.c
Determine whether a proportional relationship exists between two quantities, when given a table of values, context, or graph.
- 6.PFA.2.d
When given a contextual situation representing a proportional relationship, find the unit rate and create a table of values or a graph.
- 6.PFA.2.e
Make connections between and among multiple representations of the same proportional relationship using verbal descriptions, ratio tables, and graphs.
Teacher's field guide
What This Cluster Means
What Students Need to Do
- Students decide whether two quantities have a constant multiplicative relationship in a table, graph, or situation. They find the amount for one unit, use it to complete tables, and connect words, tables, and graphs.
What Mastery Looks Like
- A student can calculate the same y-to-x unit rate from each pair in a proportional table. The student can use that rate to find missing values, describe the relationship, and create or interpret a graph through the origin.
Common Misconceptions
- Students may use an additive pattern instead of checking for a constant ratio. They may divide in the wrong order or confuse the unit rate with any ratio in the table. They may assume every straight graph is proportional, even when the line does not pass through the origin.
How to Assess It
- Give this exit ticket: A table shows x-values 2, 5, 8 and y-values 6, 15, __. Find the unit rate, fill the blank, and explain why the relationship is proportional.
Lesson moves
Ways to Teach It
Measure water into cups, record cup and milliliter pairs, find milliliters per cup, then plot the pairs.
Discuss: A car travels 150 miles in 3 hours. What does 50 mean, and how do the table and graph show it?
Play Ratio Table Relay: teams draw a card with a unit rate, complete a table, and check another team's work.
Compare grocery prices by finding cost per item, then create a table and graph showing total cost for different quantities.
Free download
Printable 6.PFA.2 Worksheet
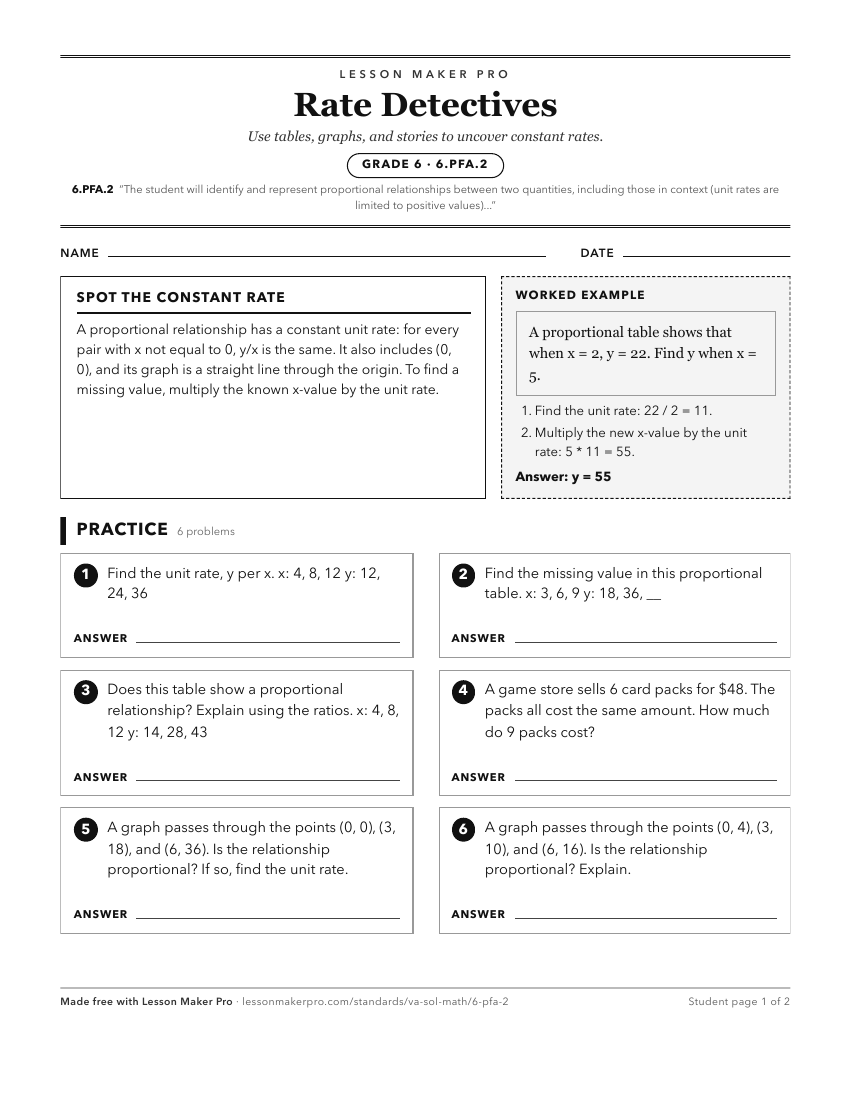
A ready-to-print activity worksheet aligned to 6.PFA.2, with an answer key for the teacher on its own page. No account needed.
PDF, US Letter, prints cleanly in black and white.
Download the worksheetKeep exploring
Related Standards
- 7.MG.2
The student will solve problems and justify relationships of similarity using proportional reasoning.
- 6.PFA.1
The student will use ratios to represent relationships between quantities, including those in context.
- 7.CE.2
The student will solve problems, including those in context, involving proportional relationships.
- 7.PFA.1
The student will investigate and analyze proportional relationships between two quantities using verbal descriptions, tables, equations in y = mx form, and grap...
Turn this cluster into a lesson
Grade, subject, topic, and the complete cluster are prefilled. Create one free, no account needed.
Also for this cluster:Make a WorksheetMake a QuizMake a Sub Lesson