Virginia SOL 6.PFA.2.e
The Standard
Make connections between and among multiple representations of the same proportional relationship using verbal descriptions, ratio tables, and graphs.
Virginia Standards of Learning for Mathematics · The student will identify and represent proportional relationships between two quantities, including those in context (unit rates are limited to positive values).
Teacher's field guide
What This Standard Means
What Students Need to Do
- Students connect a situation, ratio table, and graph that show the same constant rate. They explain how values, points, and words represent the two quantities.
What Mastery Looks Like
- Students can match a description, ratio table, and graph by identifying the common unit rate. They can explain what each axis, table column, and point means in the given situation.
Common Misconceptions
- Students may graph table values as separate categories instead of ordered pairs. They may switch the two quantities, use uneven graph scales, or match representations that have different unit rates.
How to Assess It
- Give students a short situation and a matching ratio table. Ask them to graph the pairs and write one sentence explaining how the graph and table show the same rate.
Lesson moves
Ways to Teach It
Use linking cubes to build equivalent groups, record each pair in a table, then plot the pairs on grid paper.
Ask students to explain how the point at one unit connects a graph to the unit rate in a table.
Run a card sort with situation, table, graph, and unit-rate cards, asking pairs to justify each complete set.
Use a grocery price list to create a cost table, graph total cost against quantity, and describe the price per item.
Free download
Printable 6.PFA.2.e Worksheet
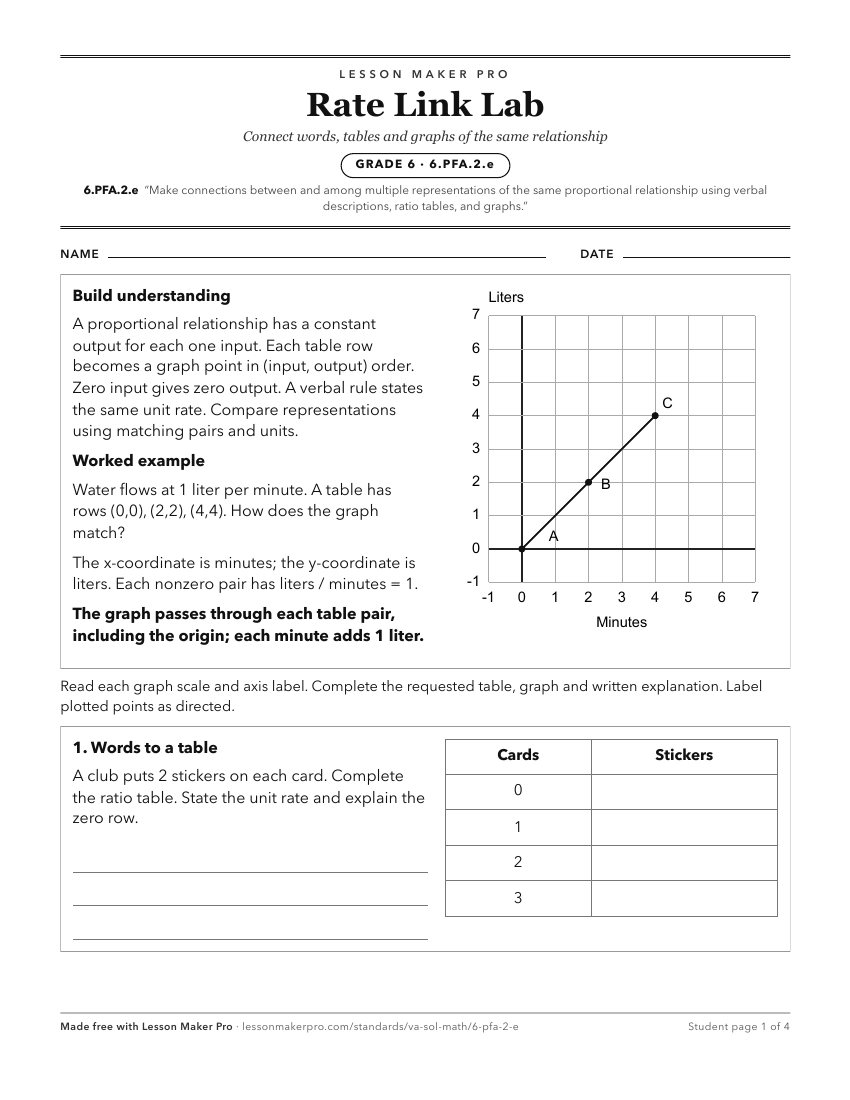
A ready-to-print activity worksheet aligned to 6.PFA.2.e, with an answer key for the teacher on its own page. No account needed.
PDF, US Letter, prints cleanly in black and white.
Download the worksheetKeep exploring
Related Standards
- 6.PFA.1.a
Represent a relationship between two quantities using ratios.
- 6.PFA.1.f
Create a table of equivalent ratios to represent a proportional relationship between two quantities, when given a contextual situation.
- 7.PFA.1.e
Make connections between and among representations of a proportional relationship between two quantities using problems in context, tables, equations, and graph...
- 7.PFA.1
The student will investigate and analyze proportional relationships between two quantities using verbal descriptions, tables, equations in y = mx form, and grap...
Turn this exact standard into a lesson
Grade, subject, topic, and the complete standard are prefilled. Create one free, no account needed.
Also for this standard:Make a WorksheetMake a QuizMake a Sub Lesson