Virginia SOL 7.PFA.1.e
The Standard
Make connections between and among representations of a proportional relationship between two quantities using problems in context, tables, equations, and graphs. Slope may include positive or negative values (slope will be limited to positive values in a contextual situation).
Virginia Standards of Learning for Mathematics · The student will investigate and analyze proportional relationships between two quantities using verbal descriptions, tables, equations in y = mx form, and graphs, including problems in context.
Teacher's field guide
What This Standard Means
What Students Need to Do
- Students move between a situation, table, equation, and graph that show the same proportional relationship. They identify the unit rate as the slope and use it to explain how the quantities change together.
What Mastery Looks Like
- A student can find the constant of proportionality from a situation, table, equation, or graph. The student can create the other representations and explain how the slope, unit rate, and constant of proportionality are connected.
Common Misconceptions
- Students may use y = mx + b and allow a nonzero intercept, even though proportional graphs pass through the origin. They may confuse the slope with one table entry or reverse the ratio. A negative slope may be mistaken for a positive slope when reading a graph from right to left.
How to Assess It
- Exit ticket: A cyclist’s time values are 0, 2, and 5 hours, with distances of 0, 6, and 15 miles. Write the equation, plot the points, and explain what the slope means.
Lesson moves
Ways to Teach It
Give pairs cards showing a table, graph, equation, and situation, then have them assemble matching sets and justify each match.
Ask students to write how they can prove two representations show the same relationship without checking every possible point.
Play a matching relay where teams connect equations, tables, and graphs, then earn a point by naming the slope correctly.
Compare hourly pay rates by creating a table, equation, and graph for each job, then decide which job pays more.
Free download
Printable 7.PFA.1.e Worksheet
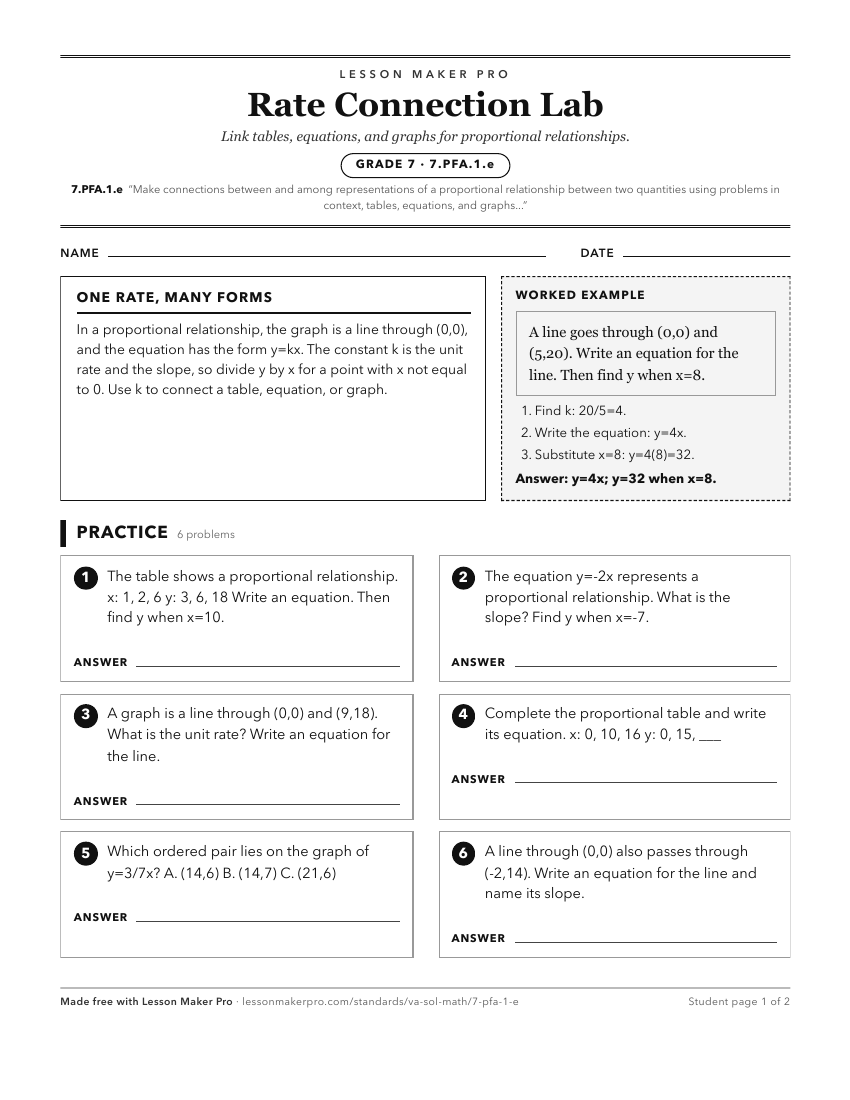
A ready-to-print activity worksheet aligned to 7.PFA.1.e, with an answer key for the teacher on its own page. No account needed.
PDF, US Letter, prints cleanly in black and white.
Download the worksheetKeep exploring
Related Standards
- 7.PFA.1.d
Graph a line representing a proportional relationship between two quantities given the equation of the line in the form y = mx, where m represents the slope as ...
- 7.PFA.1.c
Graph a line representing a proportional relationship, between two quantities given an ordered pair on the line and the slope, m, as rate of change. Slope may i...
- 7.PFA.1.a
Determine the slope, m, as the rate of change in a proportional relationship between two quantities given a table of values, graph, or contextual situation and ...
- 6.PFA.2.e
Make connections between and among multiple representations of the same proportional relationship using verbal descriptions, ratio tables, and graphs.
Turn this exact standard into a lesson
Grade, subject, topic, and the complete standard are prefilled. Create one free, no account needed.
Also for this standard:Make a WorksheetMake a QuizMake a Sub Lesson