Virginia SOL 7.PFA.1.d
The Standard
Graph a line representing a proportional relationship between two quantities given the equation of the line in the form y = mx, where m represents the slope as rate of change. Slope may include positive or negative values.
Virginia Standards of Learning for Mathematics · The student will investigate and analyze proportional relationships between two quantities using verbal descriptions, tables, equations in y = mx form, and graphs, including problems in context.
Teacher's field guide
What This Standard Means
What Students Need to Do
- Students use the coefficient of x to determine how a line rises or falls across a coordinate plane. They plot points that follow the rate and draw a straight line through the origin.
What Mastery Looks Like
- Students identify the coefficient of x as the slope and describe it as a rate of change. They graph a straight line through the origin, with the correct steepness and direction, and verify points in the equation.
Common Misconceptions
- Students may plot the slope as a y-intercept instead of starting at the origin. They may reverse rise and run, ignore a negative sign, or plot points that do not form a straight line.
How to Assess It
- Give students y = -1.5x and a blank coordinate grid. Ask them to graph the line, label two points, and explain how the slope determined each point.
Lesson moves
Ways to Teach It
Use a taped floor grid and have students step from the origin using the rise and run for positive and negative slopes.
Ask students to compare y = 2x and y = -2x, then write how the sign changes the graph.
Play Slope Match with cards showing equations, graphs, tables, and rates, and have teams build matching sets.
Graph the change in a tank's water volume over time when water drains at 3 gallons per minute.
Free download
Printable 7.PFA.1.d Worksheet
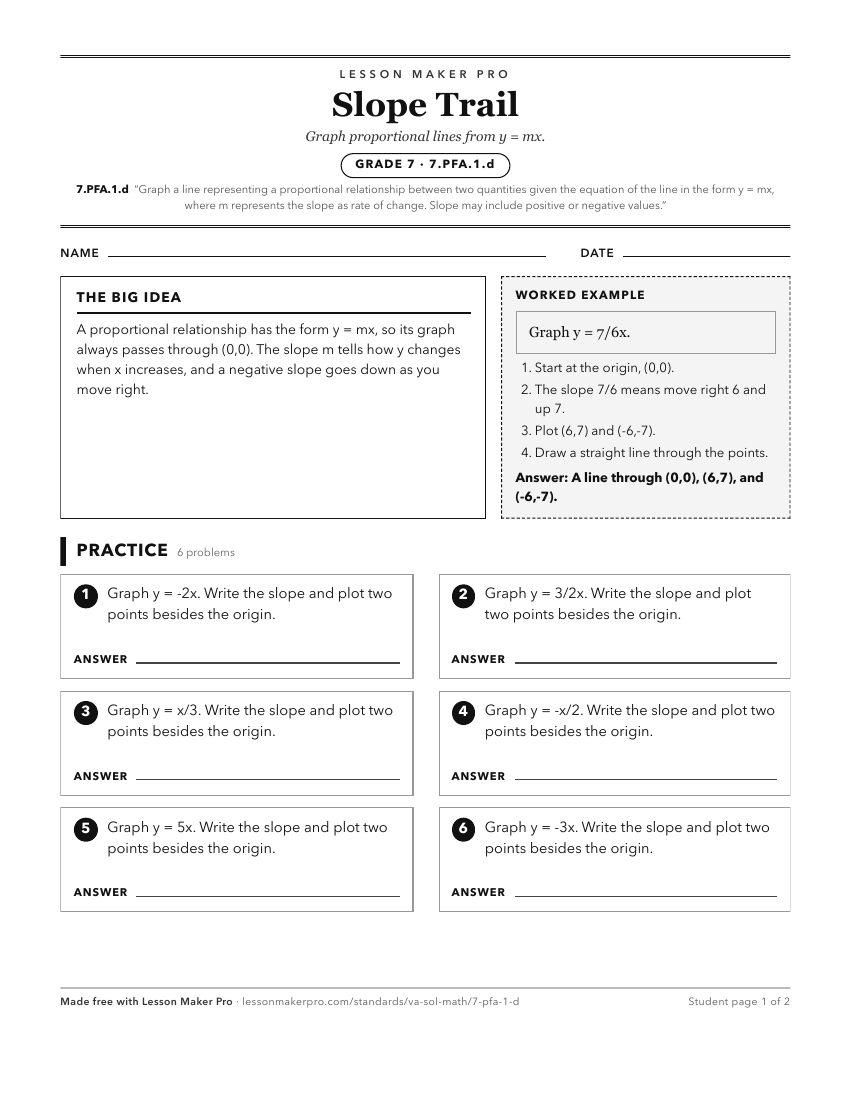
A ready-to-print activity worksheet aligned to 7.PFA.1.d, with an answer key for the teacher on its own page. No account needed.
PDF, US Letter, prints cleanly in black and white.
Download the worksheetKeep exploring
Related Standards
- 8.PFA.3.a
Determine how adding a constant (b) to the equation of a proportional relationship y = mx will translate the line on a graph.
- 7.PFA.1.c
Graph a line representing a proportional relationship, between two quantities given an ordered pair on the line and the slope, m, as rate of change. Slope may i...
- 7.PFA.1.a
Determine the slope, m, as the rate of change in a proportional relationship between two quantities given a table of values, graph, or contextual situation and ...
- 7.PFA.1.e
Make connections between and among representations of a proportional relationship between two quantities using problems in context, tables, equations, and graph...
Turn this exact standard into a lesson
Grade, subject, topic, and the complete standard are prefilled. Create one free, no account needed.
Also for this standard:Make a WorksheetMake a QuizMake a Sub Lesson