Virginia SOL 7.PFA.1.b
The Standard
Identify and describe a line with a slope that is positive, negative, or zero (0), given a graph.
Virginia Standards of Learning for Mathematics · The student will investigate and analyze proportional relationships between two quantities using verbal descriptions, tables, equations in y = mx form, and graphs, including problems in context.
Teacher's field guide
What This Standard Means
What Students Need to Do
- Students read each graph from left to right and notice whether the line rises, falls, or stays level. They use that direction to name the slope as positive, negative, or zero.
What Mastery Looks Like
- Students correctly label increasing lines as positive, decreasing lines as negative, and horizontal lines as zero slope. They justify each label by describing how y changes as x increases.
Common Misconceptions
- Students may judge a line by where it sits instead of how it moves from left to right. They may confuse steepness with whether the slope is positive or negative. Some call a vertical line zero slope, even though its slope is undefined.
How to Assess It
- Give students three small graphs showing an increasing, decreasing, and horizontal line. Ask them to label each slope and explain one choice using left-to-right movement.
Lesson moves
Ways to Teach It
Stretch yarn across a coordinate grid in three directions, then have students label each model as positive, negative, or zero slope.
Show one line and ask, "What happens to y as x increases, and what does that tell us about the slope?"
Play a card sort matching graph cards with positive, negative, or zero slope labels, then check matches with a partner.
Graph distance from home over time for someone walking away, returning, or stopping, then identify the slope type for each segment.
Free download
Printable 7.PFA.1.b Worksheet
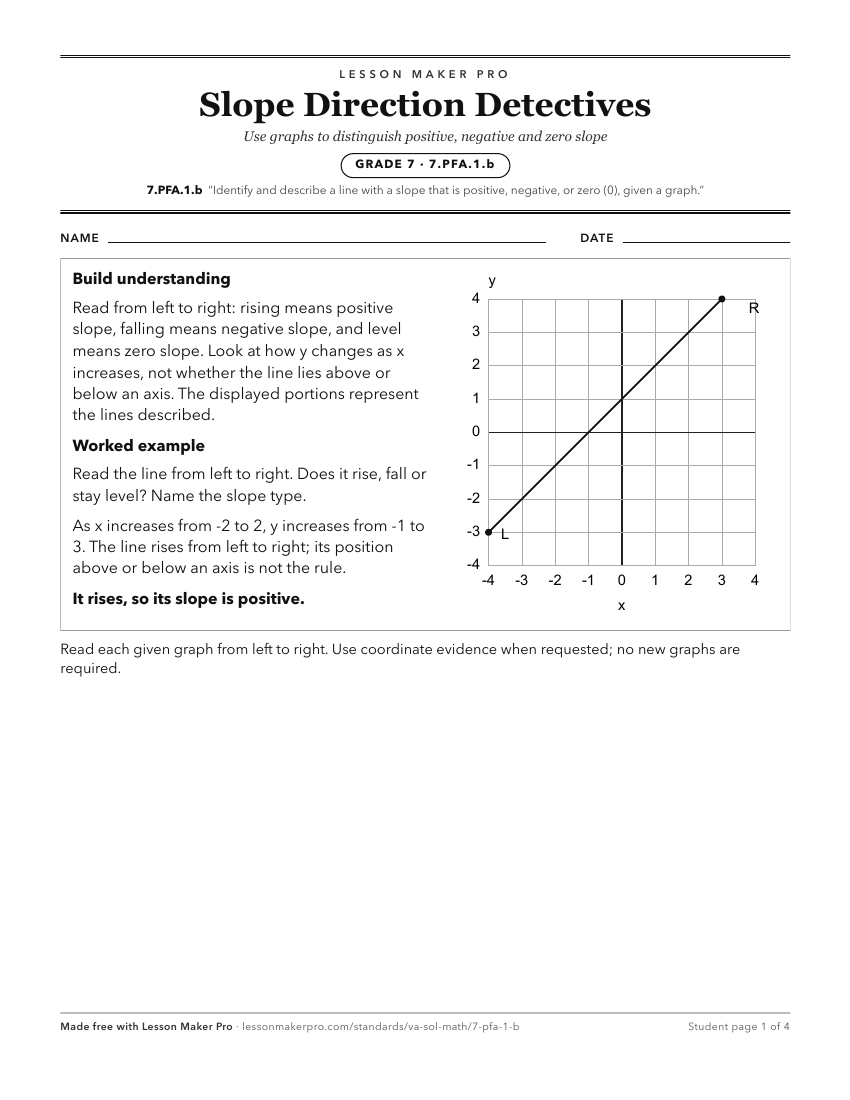
A ready-to-print activity worksheet aligned to 7.PFA.1.b, with an answer key for the teacher on its own page. No account needed.
PDF, US Letter, prints cleanly in black and white.
Download the worksheetKeep exploring
Related Standards
- 7.PFA.1.d
Graph a line representing a proportional relationship between two quantities given the equation of the line in the form y = mx, where m represents the slope as ...
- 7.PFA.1.c
Graph a line representing a proportional relationship, between two quantities given an ordered pair on the line and the slope, m, as rate of change. Slope may i...
- 7.PFA.1.a
Determine the slope, m, as the rate of change in a proportional relationship between two quantities given a table of values, graph, or contextual situation and ...
- 7.PFA.1.e
Make connections between and among representations of a proportional relationship between two quantities using problems in context, tables, equations, and graph...
Turn this exact standard into a lesson
Grade, subject, topic, and the complete standard are prefilled. Create one free, no account needed.
Also for this standard:Make a WorksheetMake a QuizMake a Sub Lesson