Virginia SOL USII.3.e
The Standard
- USII.3
- The student will apply history and social science skills to understand how industrialization changed life in rural and urban America after the Civil War by
examining the cause-and-effect relationship between rapid population growth and city government services and infrastructure
Virginia Standards of Learning for History and Social Science
Teacher's field guide
What This Standard Means
What Students Need to Do
- Students explain how fast city growth increased demand for water, sewers, roads, transit, schools, police, fire protection, and trash removal. They connect population changes to specific government actions and public problems.
What Mastery Looks Like
- Students can build a clear cause-and-effect chain using historical evidence. They can explain how delayed or expanded services affected health, safety, transportation, and daily life.
Common Misconceptions
- Students may think city services expanded automatically as population grew. They may also treat infrastructure as only roads, or confuse private businesses with services provided by city government.
How to Assess It
- Give students this exit prompt: “A city’s population doubles in ten years. Name two services affected and explain one likely result for each.”
Lesson moves
Ways to Teach It
Give groups blocks, string, and a city map, then have them redesign water, sewer, road, and fire systems for a doubled population.
Ask students to write: “Which city service should leaders expand first during rapid growth, and what evidence supports your choice?”
Play a cause-and-effect card match using population changes, service demands, government responses, and results such as cleaner water or crowded streets.
Examine a local growth map and city budget, then identify one service that would need more funding as new neighborhoods appear.
Free download
Printable USII.3.e Worksheet
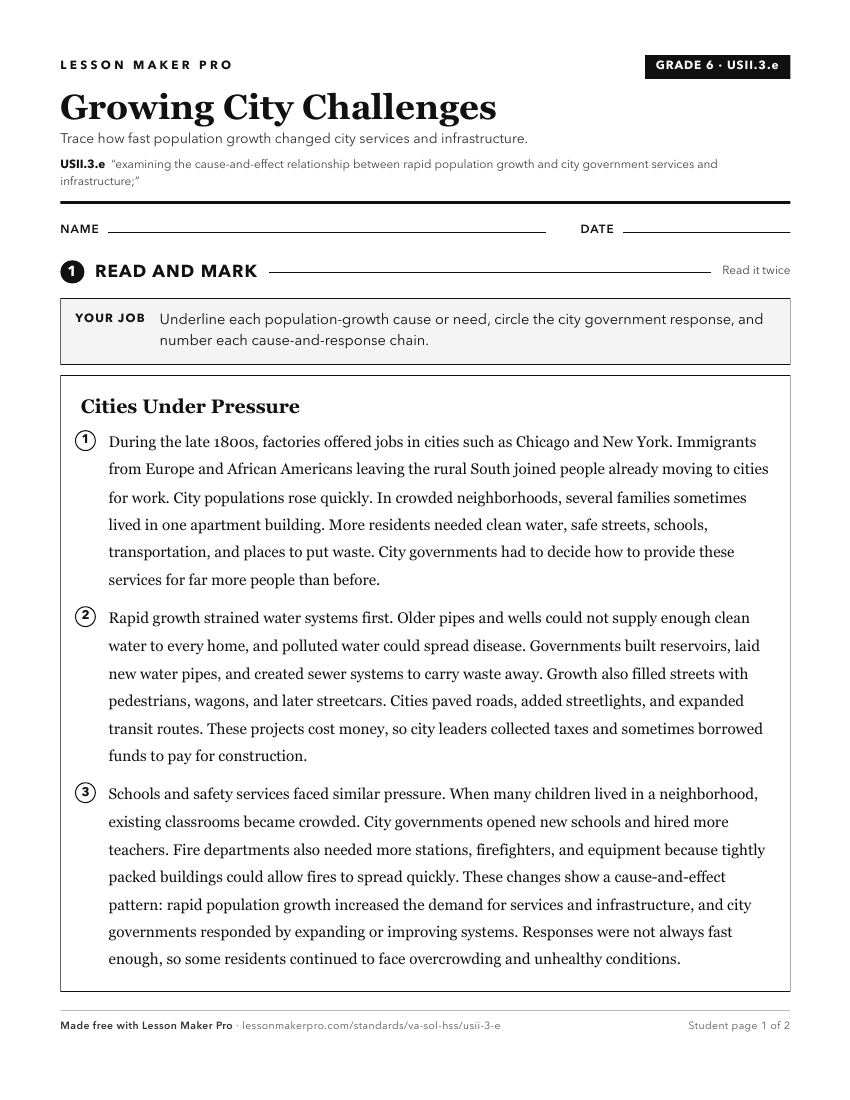
A ready-to-print activity worksheet aligned to USII.3.e, with an answer key for the teacher on its own page. No account needed.
PDF, US Letter, prints cleanly in black and white.
Download the worksheetKeep exploring
Related Standards
- WG.15.b
explaining how the functions of towns and cities have changed over time.
- WG.12.a
examining the relationship between demographic data to determine the level of economic development
- CE.13.b
explaining how and why government provides certain public goods and services
- USII.3.a
explaining relationships among natural resources, transportation, and industrial development from 1865
Turn this exact standard into a lesson
Grade, subject, topic, and the complete standard are prefilled. Create one free, no account needed.
Also for this standard:Make a WorksheetMake a QuizMake a Sub Lesson