Virginia SOL WG.12.a
The Standard
- WG.12
- The student will apply social science skills to understand the distribution, growth rates, and characteristics of human population by
examining the relationship between demographic data to determine the level of economic development
Virginia Standards of Learning for History and Social Science · The student will apply social science skills to understand the distribution, growth rates, and characteristics of human population by
Teacher's field guide
What This Standard Means
What Students Need to Do
- Students read measures such as birth rate, infant mortality, life expectancy, fertility, and population growth. They compare several measures to infer economic development and support the inference with evidence.
What Mastery Looks Like
- Given a demographic table, students can classify countries by likely development level and cite at least two supporting indicators. They can explain exceptions and avoid judging from one statistic alone.
Common Misconceptions
- Students may assume a large population always means low development or that population growth means economic growth. They may also rely on one indicator and ignore conflicting data.
How to Assess It
- Exit ticket: A country has a fertility rate of 1.7, life expectancy of 82 years, and infant mortality of 3 per 1,000. Identify its likely development level and cite two figures.
Lesson moves
Ways to Teach It
Give groups country data cards to sort from lower to higher development, then require two statistics to justify each placement.
Ask students to write: Which two demographic indicators best reveal economic development, and why are they stronger than population size?
Play Indicator Match by pairing demographic statistics with likely development levels, earning a point only when the match includes a valid explanation.
Compare current World Bank data for two countries, then discuss how health care, education, and employment may explain the differences.
Free download
Printable WG.12.a Worksheet
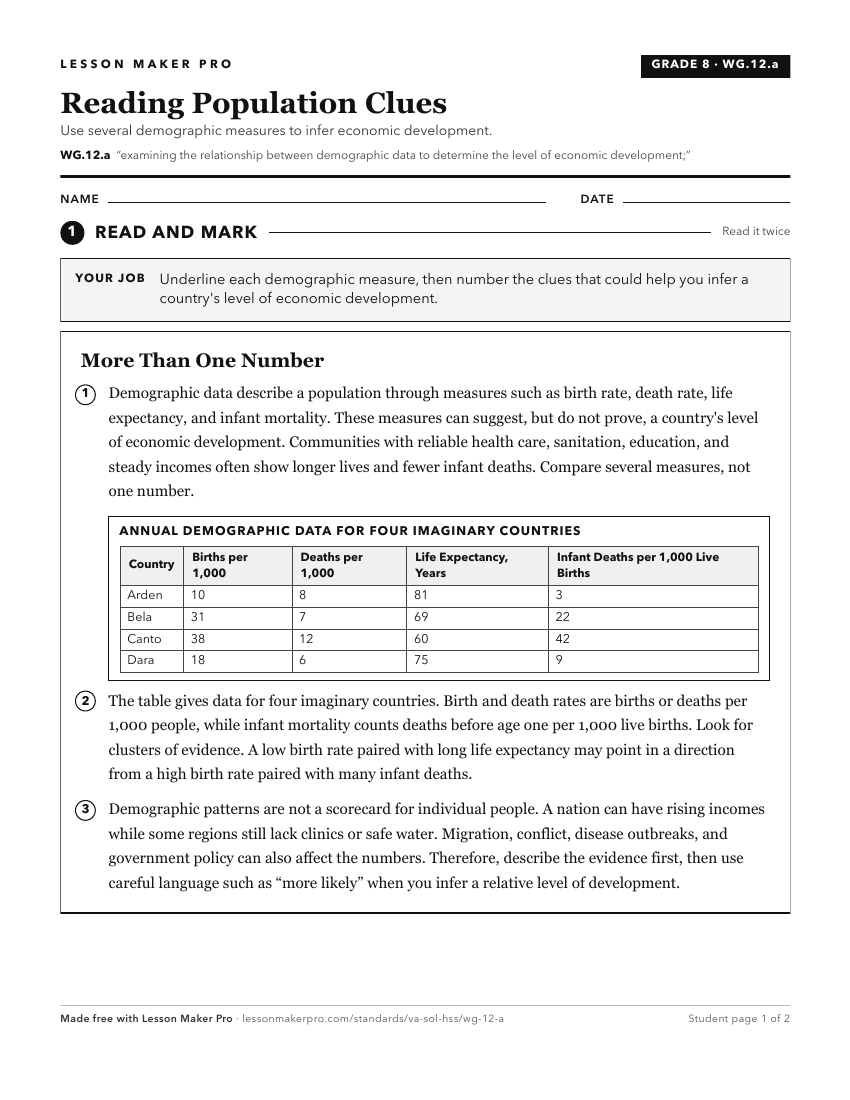
A ready-to-print activity worksheet aligned to WG.12.a, with an answer key for the teacher on its own page. No account needed.
PDF, US Letter, prints cleanly in black and white.
Download the worksheetKeep exploring
Related Standards
- WG.12.b
distinguishing between developed and developing countries
- WG.12.c
comparing and contrasting the level of economic development to the standard of living, quality of life, form of government, personal freedom, and economic oppor...
- WG.16.a
examining factors that influence the distribution of economic activities and trade
- WG.2.b
showing the influence of resources on patterns of economic activity and land use
Turn this exact standard into a lesson
Grade, subject, topic, and the complete standard are prefilled. Create one free, no account needed.
Also for this standard:Make a WorksheetMake a QuizMake a Sub Lesson