Texas TEKS 8.29.H
The Standard
- 8.29
- Social studies skills. The student applies critical-thinking skills to organize and use information acquired through established research methodologies from a variety of valid sources, including technology. The student is expected to:
pose and answer questions about geographic distributions and patterns shown on maps, graphs, and charts.
Texas Essential Knowledge and Skills for Social Studies
Teacher's field guide
What This Standard Means
What Students Need to Do
- Students examine maps, graphs, and charts to notice clusters, gaps, changes, and comparisons. They write answerable questions and use details from the visual to answer them.
What Mastery Looks Like
- Students can ask a focused question about an unfamiliar visual and answer it with accurate evidence. They use titles, legends, scales, dates, and axes correctly.
Common Misconceptions
- Students may ask questions that are too broad or cannot be answered by the visual. They may confuse totals with rates, ignore the scale or date, or claim that a pattern proves causation.
How to Assess It
- Give students a Texas population density map. Ask them to write one pattern question, answer it with two map details, and name one claim the map cannot support.
Lesson moves
Ways to Teach It
Give pairs dot stickers and a blank Texas map, then have them plot city populations and write two questions about clusters and gaps.
Project a migration graph and ask, “What pattern is visible, what question does it raise, and which data points support your answer?”
Play Pattern Detective: teams draw a map or chart card, ask an answerable question, and earn points for evidence-based answers.
Map grocery stores near the school on a printed street map, then ask which neighborhoods have the shortest and longest access.
Free download
Printable 8.29.H Worksheet
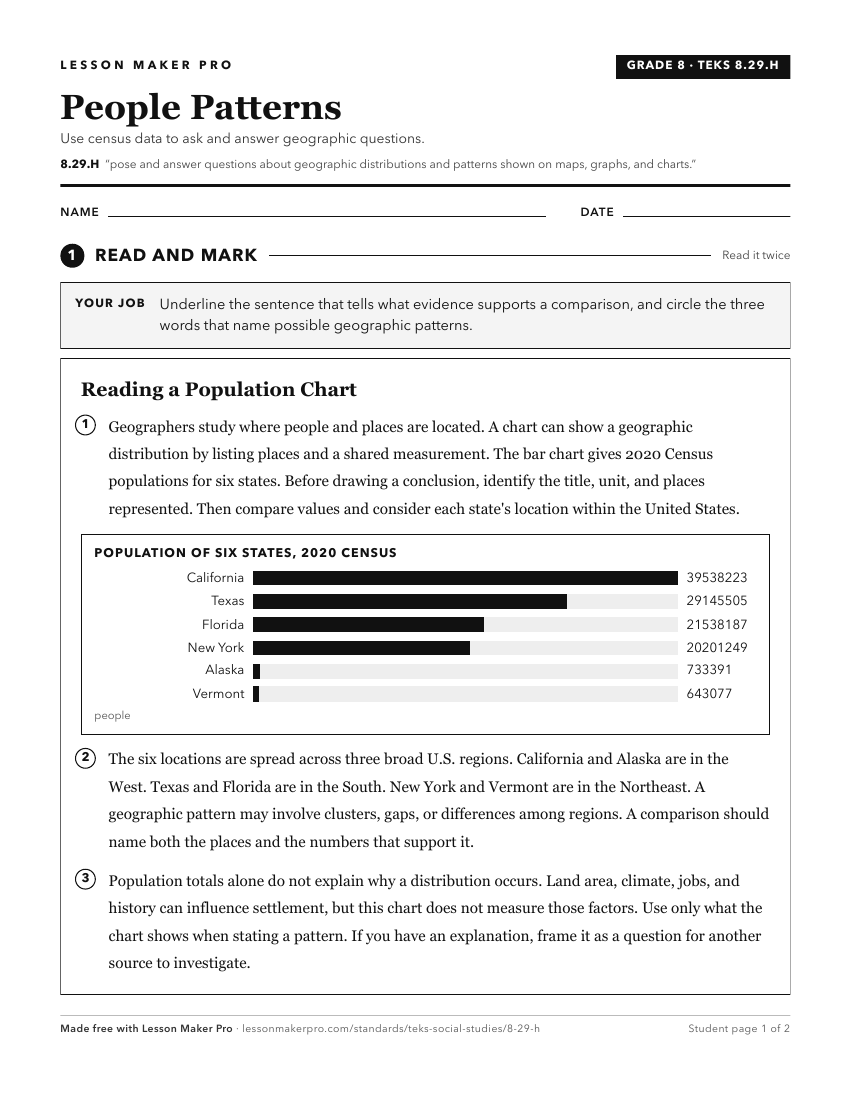
A ready-to-print activity worksheet aligned to 8.29.H, with an answer key for the teacher on its own page. No account needed.
PDF, US Letter, prints cleanly in black and white.
Download the worksheetKeep exploring
Related Standards
- 6.20.B
pose and answer questions about geographic distributions and patterns for various world regions and countries shown on maps, graphs, and charts
- 4.20.B
interpret geographic data, population distribution, and natural resources into a variety of formats such as graphs and maps.
- 5.24.B
interpret geographic data, population distribution, and natural resources into a variety of formats such as graphs and maps.
- 6.20.D
create and interpret regional sketch maps, thematic maps, graphs, and charts depicting aspects such as population, disease, and economic activities of various w...
Turn this exact standard into a lesson
Grade, subject, topic, and the complete standard are prefilled. Create one free, no account needed.
Also for this standard:Make a WorksheetMake a QuizMake a Sub Lesson