Texas TEKS 8.1.F
The Standard
- 8.1
- The student, for at least 40% of instructional time, asks questions, identifies problems, and plans and safely conducts classroom, laboratory, and field investigations to answer questions, explain phenomena, or design solutions using appropriate tools and models
construct appropriate tables, graphs, maps, and charts using repeated trials and means to organize data
Texas Essential Knowledge and Skills for Science
Teacher's field guide
What This Standard Means
What Students Need to Do
- Students collect several measurements for the same test and calculate the mean for each condition. They organize the results in a display that fits the data. They add clear titles, headings, axes, scales, and units.
What Mastery Looks Like
- A student can turn trial data into an accurate table, calculate means, and select a graph, map, or chart that matches the question. The finished display makes comparisons and patterns easy to see.
Common Misconceptions
- Students may treat the mean as the middle trial or divide the total by the wrong number. They may graph every trial when the means would answer the question better. They may use uneven scales, choose the wrong display, or omit labels and units.
How to Assess It
- Give students cart travel times for Ramp A, 2.1, 2.3, and 2.2 seconds, and Ramp B, 1.7, 1.8, and 1.9 seconds. Ask them to make a labeled table with means and a bar graph comparing the means.
Lesson moves
Ways to Teach It
Drop a paper helicopter three times from each of three heights, record fall times, calculate means, and graph mean time by height.
Give pairs a table of cart trial results and ask, "Which display best answers the question, and why?"
Play Display Match with data cards and graph, chart, or map cards, then require students to defend each match.
Use five days of temperatures for four Texas cities, calculate each city's mean, and color a map using a clear temperature key.
Free download
Printable 8.1.F Worksheet
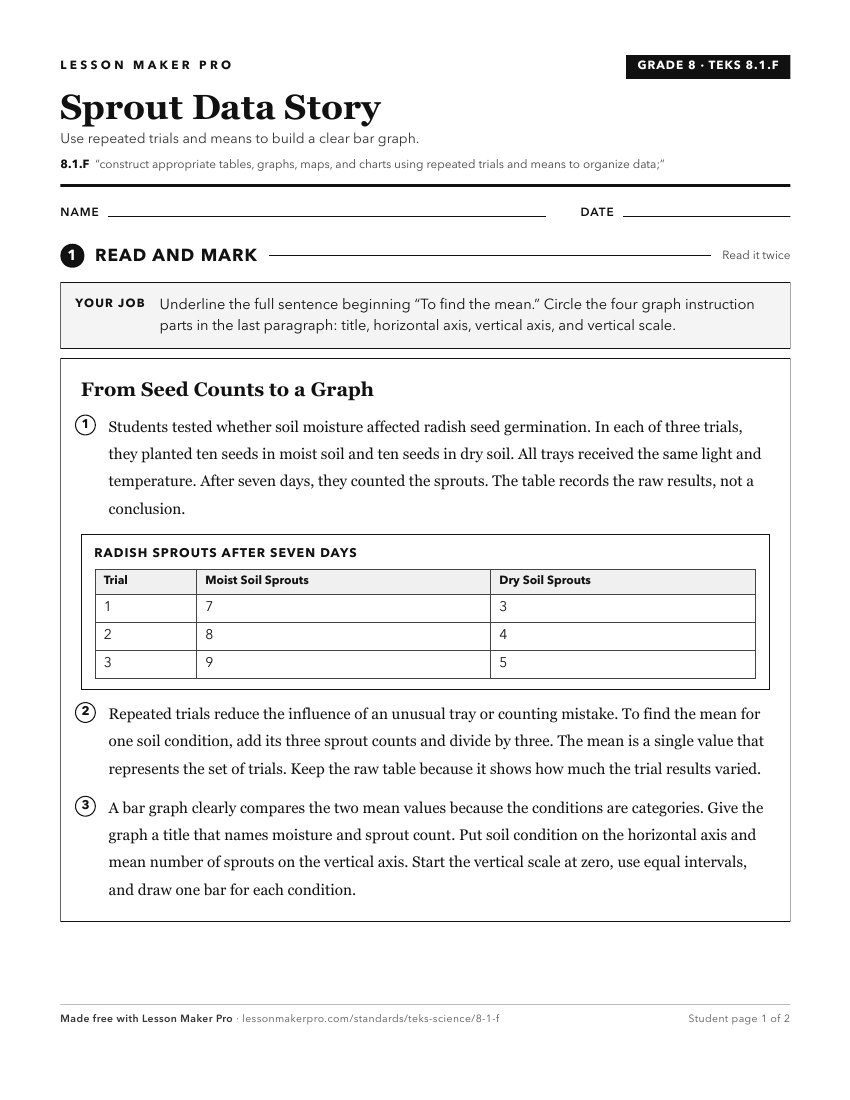
A ready-to-print activity worksheet aligned to 8.1.F, with an answer key for the teacher on its own page. No account needed.
PDF, US Letter, prints cleanly in black and white.
Download the worksheetKeep exploring
Related Standards
- 7.1.F
construct appropriate tables, graphs, maps, and charts using repeated trials and means to organize data
- 6.1.F
construct appropriate tables, graphs, maps, and charts using repeated trials and means to organize data
- 3.1.F
construct appropriate graphic organizers to collect data, including tables, bar graphs, line graphs, tree maps, concept maps, Venn diagrams, flow charts or sequ...
- 4.1.F
construct appropriate graphic organizers used to collect data, including tables, bar graphs, line graphs, tree maps, concept maps, Venn diagrams, flow charts or...
Turn this exact standard into a lesson
Grade, subject, topic, and the complete standard are prefilled. Create one free, no account needed.
Also for this standard:Make a WorksheetMake a QuizMake a Sub Lesson