Texas TEKS 3.1.F
The Standard
- 3.1
- Scientific and engineering practices. The student asks questions, identifies problems, and plans and safely conducts classroom, laboratory, and field investigations to answer questions, explain phenomena, or design solutions using appropriate tools and models. The student is expected to:
construct appropriate graphic organizers to collect data, including tables, bar graphs, line graphs, tree maps, concept maps, Venn diagrams, flow charts or sequence maps, and input-output tables that show cause and effect
Texas Essential Knowledge and Skills for Science
Teacher's field guide
What This Standard Means
What Students Need to Do
- Students choose an organizer that fits the kind of data they collect. They add clear titles, labels, categories, units, scales, arrows, or links so the information makes sense.
What Mastery Looks Like
- Students can select and build a table, graph, or map without being told which type to use. Their organizer shows accurate data and makes patterns, comparisons, sequences, or cause and effect clear.
Common Misconceptions
- Students may choose a familiar organizer even when it does not fit the data. They may use uneven graph scales, switch axes, omit units, or place categories on a line graph. They may also confuse a sequence with cause and effect.
How to Assess It
- Exit ticket: A bean plant measured 4 cm Monday, 6 cm Tuesday, 7 cm Wednesday, and 9 cm Thursday. Choose and construct the best organizer, including a title and labels.
Lesson moves
Ways to Teach It
Have groups measure four classroom objects, record the lengths in a table, then turn the data into a labeled bar graph.
Show the same data in a table and two graph types, then ask students to write which display communicates it best and why.
Give pairs investigation cards to match with organizer cards, then have them construct one organizer from a chosen card.
Use daily temperatures from a weather report to create a line graph and identify the warmest day and overall change.
Free download
Printable 3.1.F Worksheet
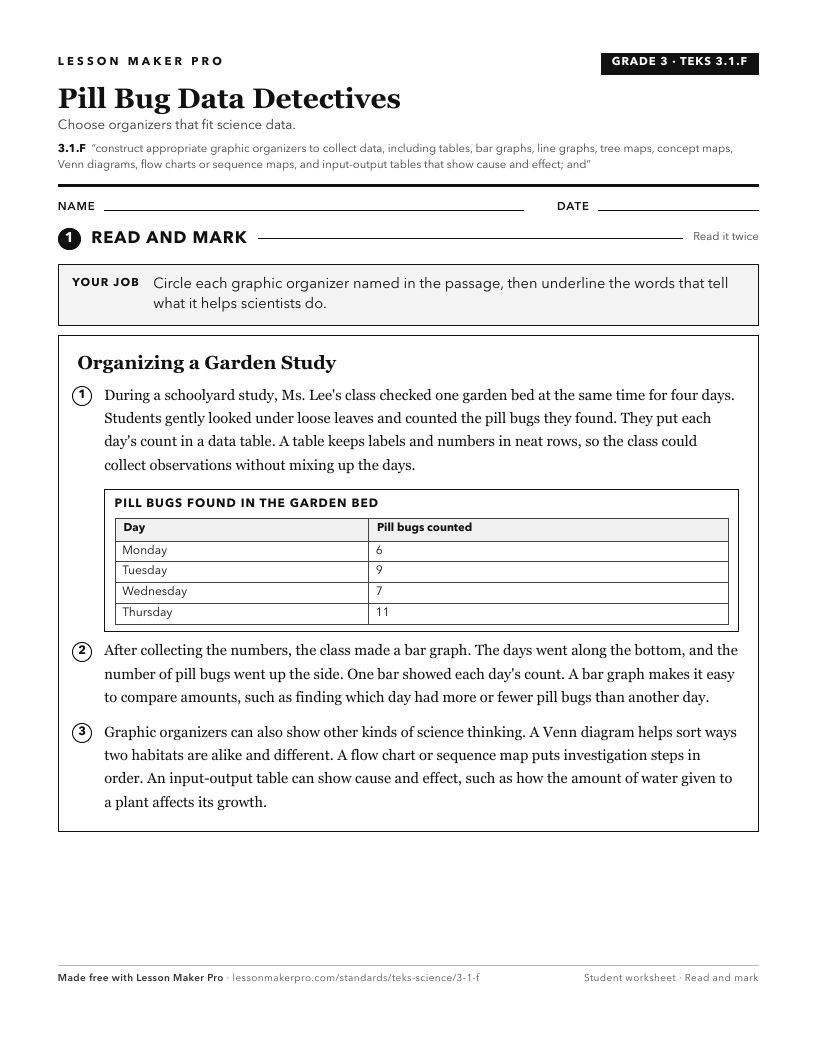
A ready-to-print activity worksheet aligned to 3.1.F, with an answer key for the teacher on its own page. No account needed.
PDF, US Letter, prints cleanly in black and white.
Download the worksheetKeep exploring
Related Standards
- 7.1.F
construct appropriate tables, graphs, maps, and charts using repeated trials and means to organize data
- 5.1.F
construct appropriate graphic organizers used to collect data, including tables, bar graphs, line graphs, tree maps, concept maps, Venn diagrams, flow charts or...
- 6.1.F
construct appropriate tables, graphs, maps, and charts using repeated trials and means to organize data
- 4.1.F
construct appropriate graphic organizers used to collect data, including tables, bar graphs, line graphs, tree maps, concept maps, Venn diagrams, flow charts or...
Turn this exact standard into a lesson
Grade, subject, topic, and the complete standard are prefilled. Create one free, no account needed.
Also for this standard:Make a WorksheetMake a QuizMake a Sub Lesson