Texas TEKS 7.1.F
The Standard
- 7.1
- Scientific and engineering practices. The student, for at least 40% of instructional time, asks questions, identifies problems, and plans and safely conducts classroom, laboratory, and field investigations to answer questions, explain phenomena, or design solutions using appropriate tools and models. The student is expected to:
construct appropriate tables, graphs, maps, and charts using repeated trials and means to organize data
Texas Essential Knowledge and Skills for Science
Teacher's field guide
What This Standard Means
What Students Need to Do
- Students record results from repeated trials and calculate a mean for each condition or group. They choose a table, graph, map, or chart that fits the data and add clear labels, units, scales, and keys.
What Mastery Looks Like
- A student accurately calculates each mean and keeps raw trial data organized. The student selects a useful display, plots values correctly, and makes the data easy to compare.
Common Misconceptions
- Students may combine unrelated trials, divide by the wrong number, or mistake one trial for the mean. They may choose the wrong display, use uneven scales, or leave out titles, labels, units, and keys.
How to Assess It
- Give students plant heights of 8, 10, and 9 cm for Plant A, and 11, 12, and 10 cm for Plant B. Ask them to create a table with means and a labeled graph comparing the plants.
Lesson moves
Ways to Teach It
Run a toy car down a ramp three times, measure distance, calculate the mean, and display results in a table and bar graph.
Show one data set in two different displays and ask, "Which display makes comparisons easier, and what evidence supports your choice?"
Give teams data cards and display cards, then have them race to match each data set with the best table, graph, map, or chart.
Find five days of temperatures for three Texas cities, calculate each mean, and shade a Texas map using a temperature key.
Free download
Printable 7.1.F Worksheet
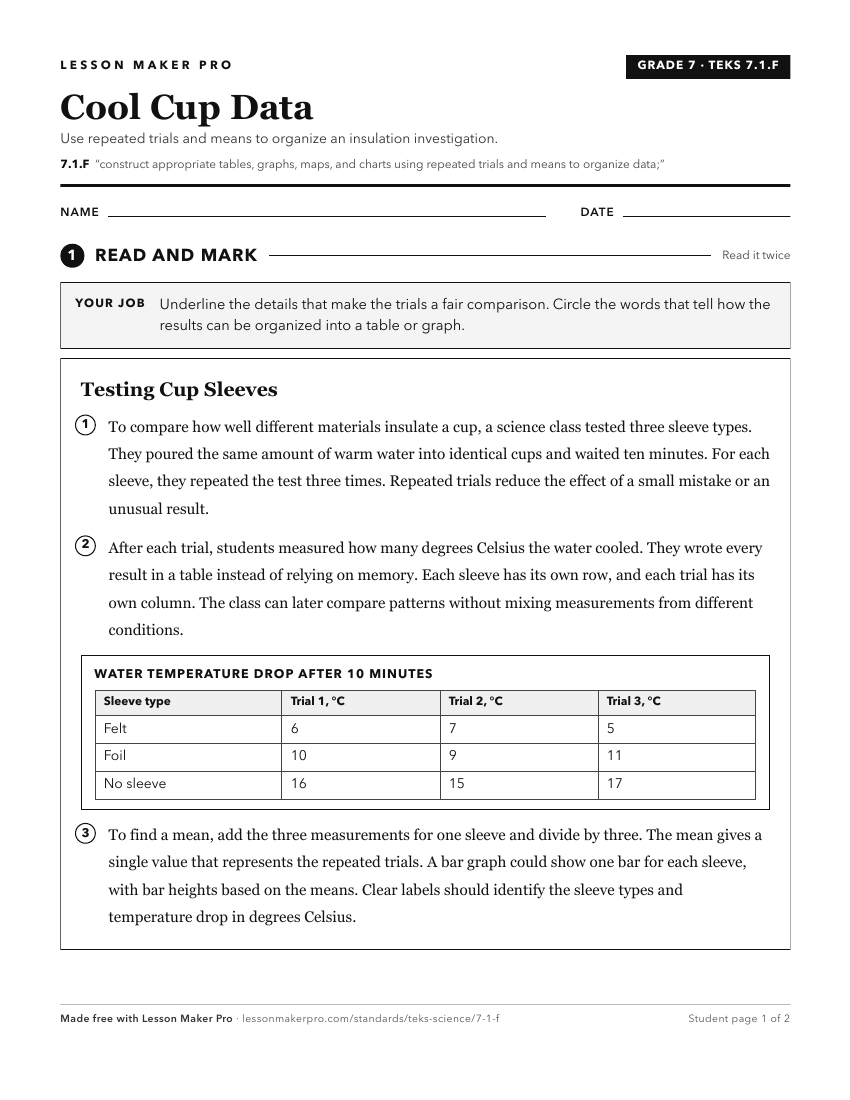
A ready-to-print activity worksheet aligned to 7.1.F, with an answer key for the teacher on its own page. No account needed.
PDF, US Letter, prints cleanly in black and white.
Download the worksheetKeep exploring
Related Standards
- 8.1.F
construct appropriate tables, graphs, maps, and charts using repeated trials and means to organize data
- 5.1.F
construct appropriate graphic organizers used to collect data, including tables, bar graphs, line graphs, tree maps, concept maps, Venn diagrams, flow charts or...
- 6.1.F
The 6th Grade version of this standard.
- 3.1.F
construct appropriate graphic organizers to collect data, including tables, bar graphs, line graphs, tree maps, concept maps, Venn diagrams, flow charts or sequ...
Turn this exact standard into a lesson
Grade, subject, topic, and the complete standard are prefilled. Create one free, no account needed.
Also for this standard:Make a WorksheetMake a QuizMake a Sub Lesson