Oklahoma Social Studies AWH.P.2.3
Standard Cluster
Demonstrate a mastery of geographic concepts and the use of geographic tools to understand the impact of geography on the past and present. Actively engage in asking and answering geographic questions by acquiring, organizing, and analyzing multiple sources of data and information about the world’s past and present. Compare and analyze complex maps and mapping technologies to analyze spatial patterns of human and physical environments, explaining relationships between the environment and events, past and present. Evaluate the extent to which political and economic decisions have had significant impact on human and physical environments of various places and regions.
Oklahoma Academic Standards for Social Studies (2026)
Cluster contents
Standards in This Cluster
AWH.P.2.3 is a cluster heading. These are the individual standards under it.
- AWH.P.2.3.A
Actively engage in asking and answering geographic questions by acquiring, organizing, and analyzing multiple sources of data and information about the world’s ...
- AWH.P.2.3.B
Compare and analyze complex maps and mapping technologies to analyze spatial patterns of human and physical environments, explaining relationships between the e...
- AWH.P.2.3.C
Evaluate the extent to which political and economic decisions have had significant impact on human and physical environments of various places and regions.
Teacher's field guide
What This Cluster Means
What Students Need to Do
- Students compare maps from different times with satellite images and data. They look for patterns in where people live, farm, and use water. They use the evidence to explain how geography shaped decisions and how those decisions changed a place.
What Mastery Looks Like
- A student checks map dates, keys, and scale before describing a change. They cite more than one source to explain how a decision affected people and the environment. They can do this for more than one region.
Common Misconceptions
- Students may read a change in map color as a real change without checking the key or date. They may blame a shrinking lake only on drought and overlook water diverted for farming. They may assume everyone in the region was affected the same way.
How to Assess It
- Give students 1960 and 2020 Aral Sea maps and a cotton harvest graph. Ask where the shoreline changed most and what the sources suggest about cotton irrigation's role.
Lesson moves
Ways to Teach It
Place tracing paper over 1960 and 2020 Aral Sea maps, mark shoreline loss, then add canals from a third map.
Ask who gained and who lost when rivers were diverted for cotton, using a cotton harvest graph and shoreline map as evidence.
Give pairs four undated Aral Sea maps; have them put the maps in order and point to the clues they used.
Compare the U.S. Drought Monitor map with USDA cropland maps, then choose a county for irrigation funding and explain why.
Free download
Printable AWH.P.2.3 Worksheet
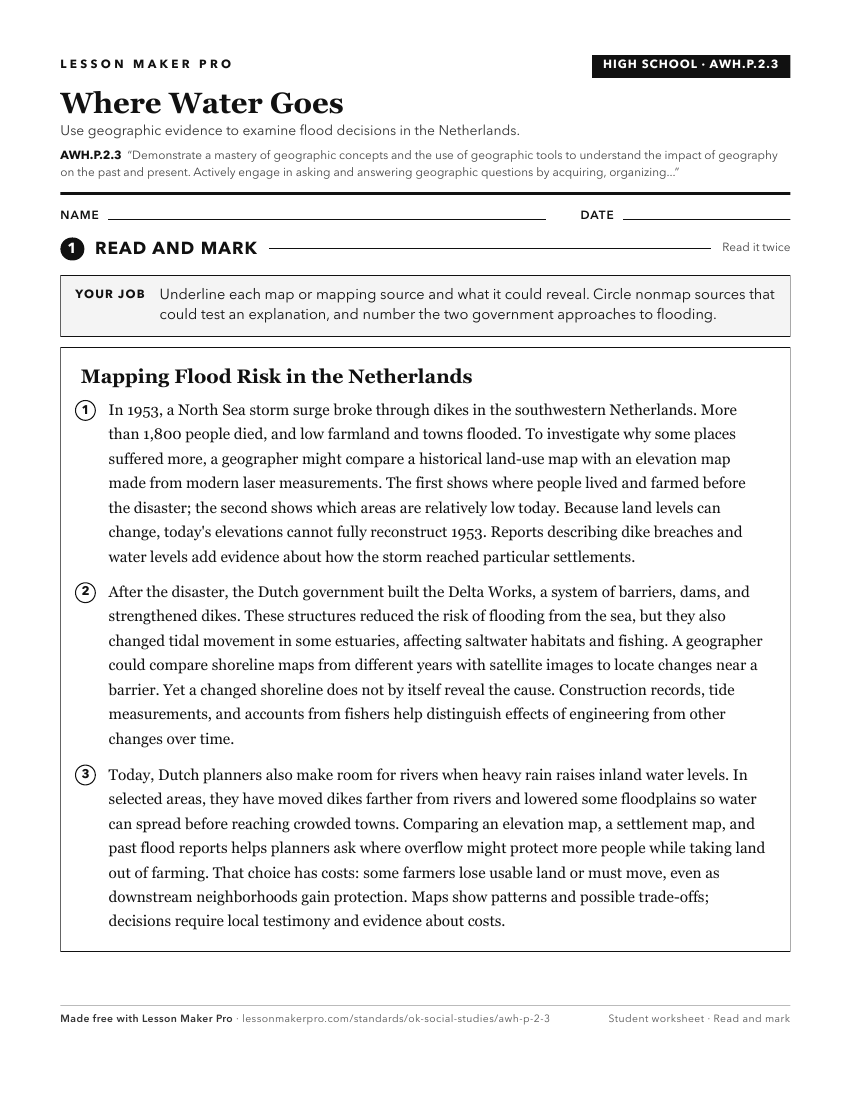
A ready-to-print activity worksheet aligned to AWH.P.2.3, with an answer key for the teacher on its own page. No account needed.
PDF, US Letter, prints cleanly in black and white.
Download the worksheetKeep exploring
Related Standards
- USH.P.2.3
Demonstrate a mastery of geographic concepts and the use of geographic tools to understand the impact of geography on the past and present.
- MWH.P.2.3
Demonstrate a mastery of geographic concepts and the use of geographic tools to understand the impact of geography on the past and present.
- 2.P.2.3
Demonstrate a mastery of geographic concepts and the use of geographic tools to understand the impact of geography on the past and present.
- 1.P.2.3
Demonstrate a mastery of geographic concepts and the use of geographic tools to understand the impact of geography on the past and present.
Turn this cluster into a lesson
Grade, subject, topic, and the complete cluster are prefilled. Create one free, no account needed.
Also for this cluster:Make a WorksheetMake a QuizMake a Sub Lesson