Oklahoma Social Studies 7.C.7.5
The Standard
- 7.C.7
- Examine and compare economic systems as means by which governments organize and distribute available resources, services, and goods.
Distinguish between developed and developing regions by analyzing data used by geographers (e.g., the Human Development Index data, literacy rate, life expectancy, infant mortality, per capita income),
Oklahoma Academic Standards for Social Studies (2026) · 7.C.7
Teacher's field guide
What This Standard Means
What Students Need to Do
- Students read data on literacy, life expectancy, infant mortality, income per person, and human development. They compare regions using several measures and support their conclusions with numbers.
What Mastery Looks Like
- A student can identify which region appears more developed and cite two or more measures as evidence. They can explain that lower infant mortality usually points to better health outcomes.
Common Misconceptions
- Students may think higher infant mortality means better health, or that income per person is what everyone earns. They may also assume every country in a region has the same living conditions.
How to Assess It
- Exit ticket: Region A has 96% literacy, an 80-year life expectancy, and 4 infant deaths per 1,000 births. Region B has 68%, 65 years, and 32. Which appears more developed? Cite two numbers.
Lesson moves
Ways to Teach It
Give pairs four printed region data cards. Have them rank the cards by literacy, life expectancy, and infant mortality, then circle conflicting rankings.
Ask: If a region has higher income but lower life expectancy, what else would you check before judging its development?
Read an indicator aloud. Teams hold up cards marked “higher” or “lower” to show which direction suggests better living conditions.
Display two rows from a UNDP development data table. Have students compare life expectancy and income, then write a headline about the difference.
Free download
Printable 7.C.7.5 Worksheet
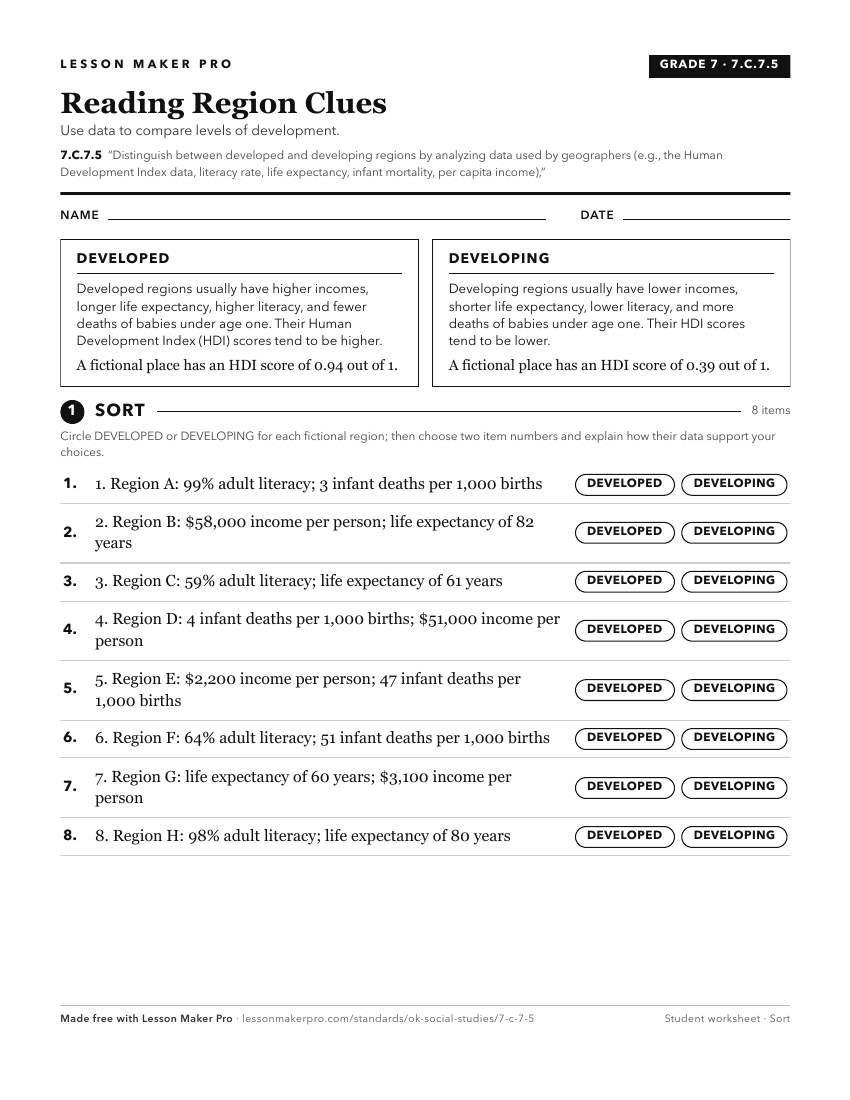
A ready-to-print activity worksheet aligned to 7.C.7.5, with an answer key for the teacher on its own page. No account needed.
PDF, US Letter, prints cleanly in black and white.
Download the worksheetKeep exploring
Related Standards
- 7.P.2.3.B
Use multiple mapping techniques, data visuals, satellite images, and geographic technology to analyze spatial patterns of physical and human characteristics, ma...
- 6.C.6.4
Identify and compare the characteristics of developed and developing countries by analyzing data (e.g., literacy rate, life expectancy, per capita income, and i...
- 6.P.2.3.B
Use multiple mapping techniques, data visuals, satellite images, and geographic technology to analyze spatial patterns of physical and human characteristics, ma...
- WG.C.6.3
Compare contemporary patterns of industrialization and development in selected regions of the world.
Turn this exact standard into a lesson
Grade, subject, topic, and the complete standard are prefilled. Create one free, no account needed.
Also for this standard:Make a WorksheetMake a QuizMake a Sub Lesson