Oklahoma Math S.DA.5
Standard Cluster
Make statistical inferences and evaluate claims from studies. Construct and interpret confidence intervals for the mean of a normally distributed population and for a population proportion. Explain how a sample statistic and a confidence level are used in the construction of a confidence interval. Explain how changes in the sample size, confidence level, and standard error affect the margin of error of a confidence interval. Construct a confidence interval for the mean of a normally distributed population (with a known standard deviation) and for a population proportion. Use confidence intervals to evaluate claims. Use confidence intervals to evaluate claims for a single population parameter.
Oklahoma Academic Standards for Mathematics (2022)
Cluster contents
Standards in This Cluster
S.DA.5 is a cluster heading. These are the individual standards under it.
- S.DA.5.1
Construct and interpret confidence intervals for the mean of a normally distributed population and for a population proportion.
- S.DA.5.2
Explain how a sample statistic and a confidence level are used in the construction of a confidence interval.
- S.DA.5.3
Explain how changes in the sample size, confidence level, and standard error affect the margin of error of a confidence interval.
- S.DA.5.4
Construct a confidence interval for the mean of a normally distributed population (with a known standard deviation) and for a population proportion. Use confide...
- S.DA.5.5
Use confidence intervals to evaluate claims for a single population parameter.
Teacher's field guide
What This Cluster Means
What Students Need to Do
- Students build intervals around a sample mean or proportion using a confidence level and standard error. For a mean, they work with a normally distributed population and a known population standard deviation. They use each interval to check a claim about the population.
What Mastery Looks Like
- Students calculate mean and proportion intervals with the right center and margin of error. They explain that a larger sample lowers standard error and narrows the interval, while greater confidence widens it. They decide whether a claimed value falls inside the interval without calling the claim proved.
Common Misconceptions
- Students may say a 95% interval gives the fixed population value a 95% chance of being inside it. They may confuse the margin of error with the full width of the interval. Some treat a claim inside the interval as proved or think a larger sample makes the interval wider.
How to Assess It
- Exit ticket: Normally distributed bag weights have a known standard deviation of 4 g. A random sample of 25 bags averages 102 g. Find the 95% interval and decide whether it supports a claim of 100 g.
Lesson moves
Ways to Teach It
Put 40 red and 60 blue counters in a bag; groups make 50 draws with replacement and build 95% proportion intervals.
Ask: A 95% interval for voter support is 48% to 54%; does it show a majority supports the proposal? Explain in two sentences.
Post cards with sample size, sample mean, and known population standard deviation; teams calculate 90% and 95% intervals and compare widths.
Compare a 500 g cereal label with a 95% interval from 36 boxes averaging 496 g; known standard deviation is 12 g.
Free download
Printable S.DA.5 Worksheet
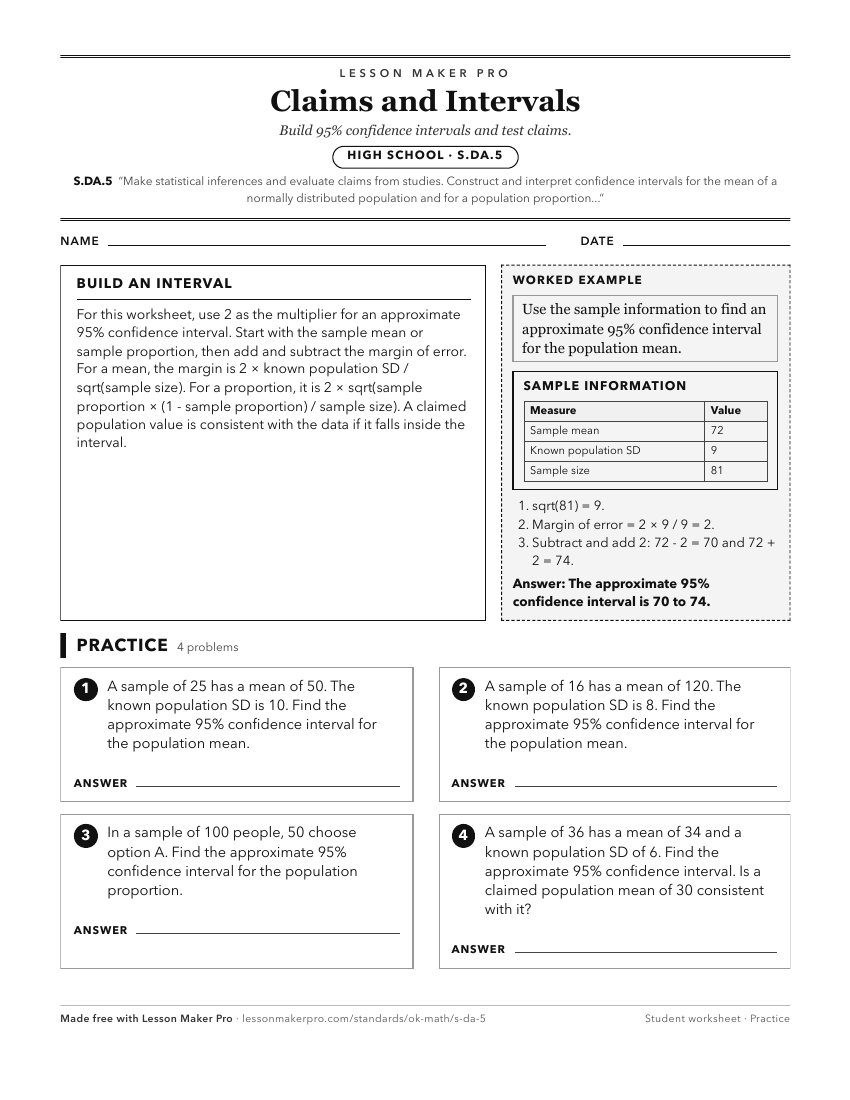
A ready-to-print activity worksheet aligned to S.DA.5, with an answer key for the teacher on its own page. No account needed.
PDF, US Letter, prints cleanly in black and white.
Download the worksheetKeep exploring
Related Standards
- A2.D.2
Analyze statistical thinking to draw inferences, make predictions, and justify conclusions.
- S.IR.3.2
Evaluate the statistical validity of claims made.
- A2.D.2.1
Evaluate reports by making inferences, justifying conclusions, and determining appropriateness of data collection methods. Show how graphs and data can be disto...
- S.IR.2.1
Develop and critique arguments for practical implications based on statistical significance.
Turn this cluster into a lesson
Grade, subject, topic, and the complete cluster are prefilled. Create one free, no account needed.
Also for this cluster:Make a WorksheetMake a QuizMake a Sub Lesson