Oklahoma Math A2.D.2
Standard Cluster
Analyze statistical thinking to draw inferences, make predictions, and justify conclusions. Evaluate reports by making inferences, justifying conclusions, and determining appropriateness of data collection methods. Show how graphs and data can be distorted to support different points of view. Identify and explain misleading conclusions and graphical representations of data sets. Differentiate between correlation and causation when describing the relationship between two variables.
Oklahoma Academic Standards for Mathematics (2022)
Cluster contents
Standards in This Cluster
A2.D.2 is a cluster heading. These are the individual standards under it.
Teacher's field guide
What This Cluster Means
What Students Need to Do
- Students check how data were collected before using a report to make a claim or prediction. They compare graphs of the same data and explain why a relationship between two variables does not prove cause.
What Mastery Looks Like
- A student can spot a biased sample and explain why it limits a prediction. They can identify a misleading graph, support a conclusion with numbers, and suggest another reason two variables move together.
Common Misconceptions
- Students may treat a survey of whoever was nearby as if it represents everyone. They may see a cut-off graph axis as a large change or assume one correlated variable caused the other.
How to Assess It
- Exit ticket: A school polls 20 basketball players, finds that 80% want a longer season, and shows the result on a bar graph that starts at 70%. Ask students to identify the sampling problem, explain the graph's effect, and write a conclusion the data support.
Lesson moves
Ways to Teach It
Have pairs survey five students at lunch and five in class about a menu choice, then compare the results.
Show a bar graph with a vertical axis starting at 80; ask students to write how its scale changes the story.
Give teams variable-pair cards, such as ice cream sales and sunburns; award a point for naming a plausible third factor.
Compare stock-price charts for the same company, one covering a day and one covering a year; ask which supports a claim of steady growth.
Free download
Printable A2.D.2 Worksheet
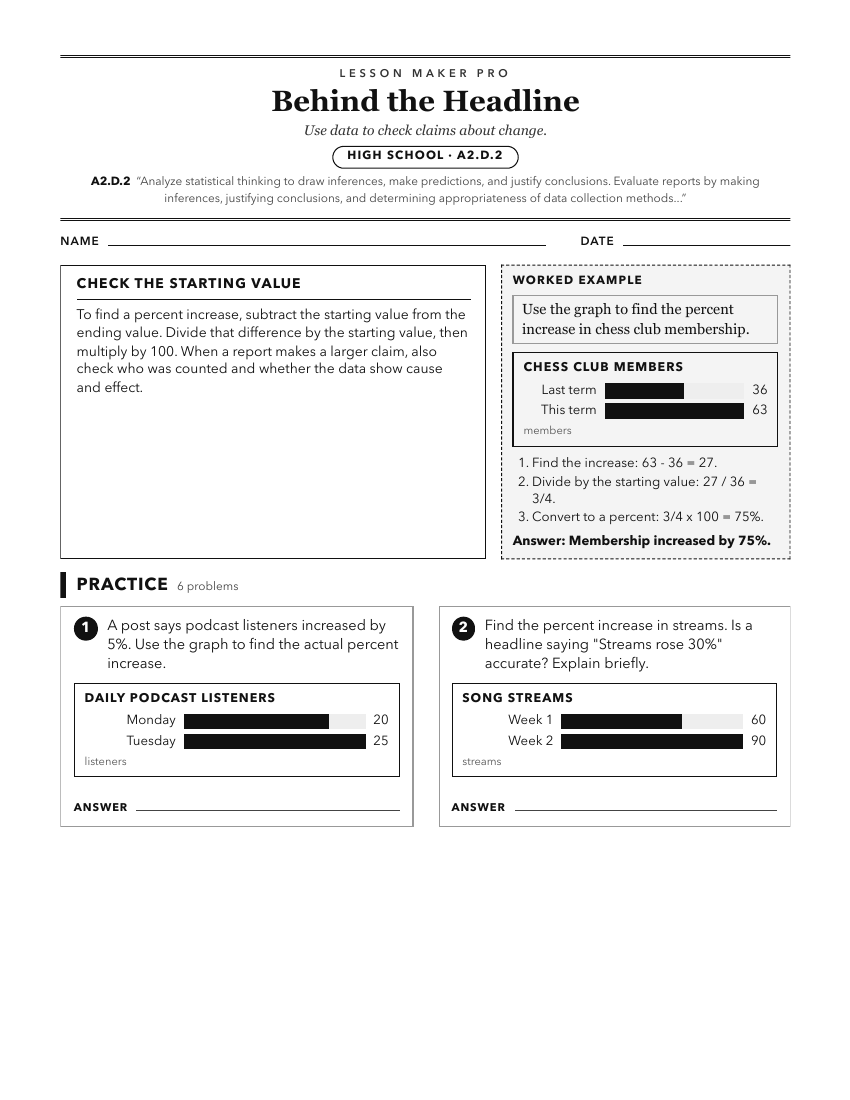
A ready-to-print activity worksheet aligned to A2.D.2, with an answer key for the teacher on its own page. No account needed.
PDF, US Letter, prints cleanly in black and white.
Download the worksheetKeep exploring
Related Standards
Turn this cluster into a lesson
Grade, subject, topic, and the complete cluster are prefilled. Create one free, no account needed.
Also for this cluster:Make a WorksheetMake a QuizMake a Sub Lesson