Oklahoma Math A2.D.2.2
The Standard
- A2.D.2
- Analyze statistical thinking to draw inferences, make predictions, and justify conclusions.
Identify and explain misleading conclusions and graphical representations of data sets.
Oklahoma Academic Standards for Mathematics (2022)
Teacher's field guide
What This Standard Means
What Students Need to Do
- Students check whether a graph shows the data fairly. They explain when a claim goes beyond what the data can support.
What Mastery Looks Like
- A student can spot a bar chart with a cut-off axis and explain how it makes a small difference look large. They can say why a survey of eight volunteers cannot represent the whole school.
Common Misconceptions
- Students may judge bars by their height without reading the axis numbers. They may assume a large-looking difference is large in the data, or that any survey represents everyone.
How to Assess It
- Show a bar chart with values 40 and 44, but a vertical axis starting at 39. Ask: Does the chart fairly show the difference? Explain, then sketch a better axis.
Lesson moves
Ways to Teach It
Give pairs graph paper and values 40 and 44; have them draw bar charts starting at zero and at 39, then compare.
Ask: Eight basketball players say basketball is the school's favorite sport. What can this survey actually tell us?
Give pairs graph cards with cut-off axes, uneven tick marks, or missing labels; have them name each problem and fix one card.
Show two mock phone-plan ads for 10 GB and 12 GB; have students check whether the bars make the difference look fair.
Free download
Printable A2.D.2.2 Worksheet
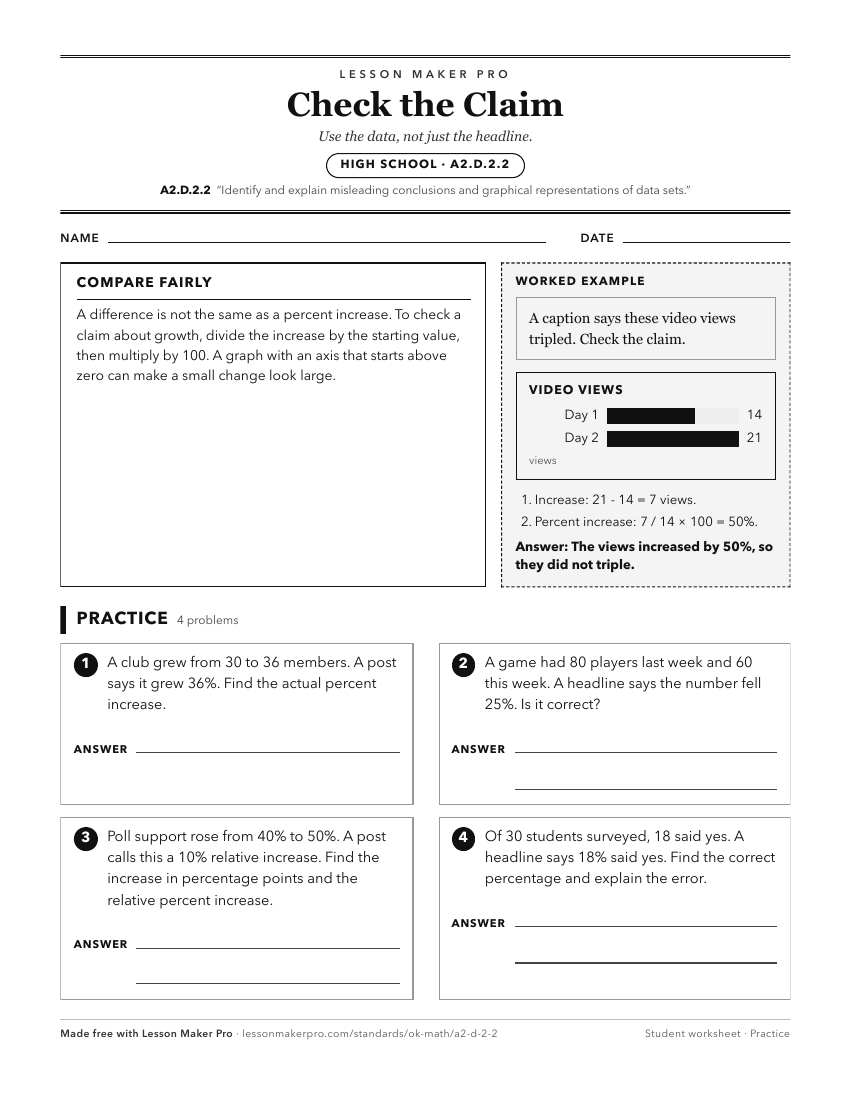
A ready-to-print activity worksheet aligned to A2.D.2.2, with an answer key for the teacher on its own page. No account needed.
PDF, US Letter, prints cleanly in black and white.
Download the worksheetKeep exploring
Related Standards
- A2.D.2.1
Evaluate reports by making inferences, justifying conclusions, and determining appropriateness of data collection methods. Show how graphs and data can be disto...
- S.Q.3.2
Compare and contrast different potential graphical or visual representations given the same data set.
- 7.D.1.2
Use reasoning with proportions to display and interpret data in circle graphs (pie charts) and histograms.
- 1.D.1.3
Draw conclusions from pictographs and bar graphs.
Turn this exact standard into a lesson
Grade, subject, topic, and the complete standard are prefilled. Create one free, no account needed.
Also for this standard:Make a WorksheetMake a QuizMake a Sub Lesson