Oklahoma Math A2.D.2.1
The Standard
- A2.D.2
- Analyze statistical thinking to draw inferences, make predictions, and justify conclusions.
Evaluate reports by making inferences, justifying conclusions, and determining appropriateness of data collection methods. Show how graphs and data can be distorted to support different points of view.
Oklahoma Academic Standards for Mathematics (2022)
Teacher's field guide
What This Standard Means
What Students Need to Do
- Students check who was surveyed and whether a report’s claim goes beyond the data. They explain how a graph’s scale or missing data can change the impression it gives.
What Mastery Looks Like
- Students can spot an unrepresentative sample and limit a conclusion to the group actually studied. They can redraw a graph with a scale starting at zero and explain what the original scale exaggerated.
Common Misconceptions
- Students may think a large sample represents everyone, even if all responses come from one group. They may mistake a small difference for a large one when a bar graph starts near the data values. They may overlook survey questions that push people toward an answer.
How to Assess It
- Exit ticket: A survey of 40 basketball players finds 80% like basketball and 78% like soccer. A bar graph starts at 75%. Explain one flaw in a claim about the whole school and one misleading feature of the graph.
Lesson moves
Ways to Teach It
Hand pairs five lunch survey responses from one table; have them write one claim about that table and one claim they cannot make about the school.
Show bar graphs of 50% and 55% with axes starting at 0 and 49%; ask which makes the gap look larger and why.
Run a claim-check relay: teams match class and schoolwide pizza claims to a class poll or a random schoolwide poll.
Use grocery receipts showing milk at $3.80 and $3.90; graph the prices with axes starting at zero and $3.75, then compare impressions.
Free download
Printable A2.D.2.1 Worksheet
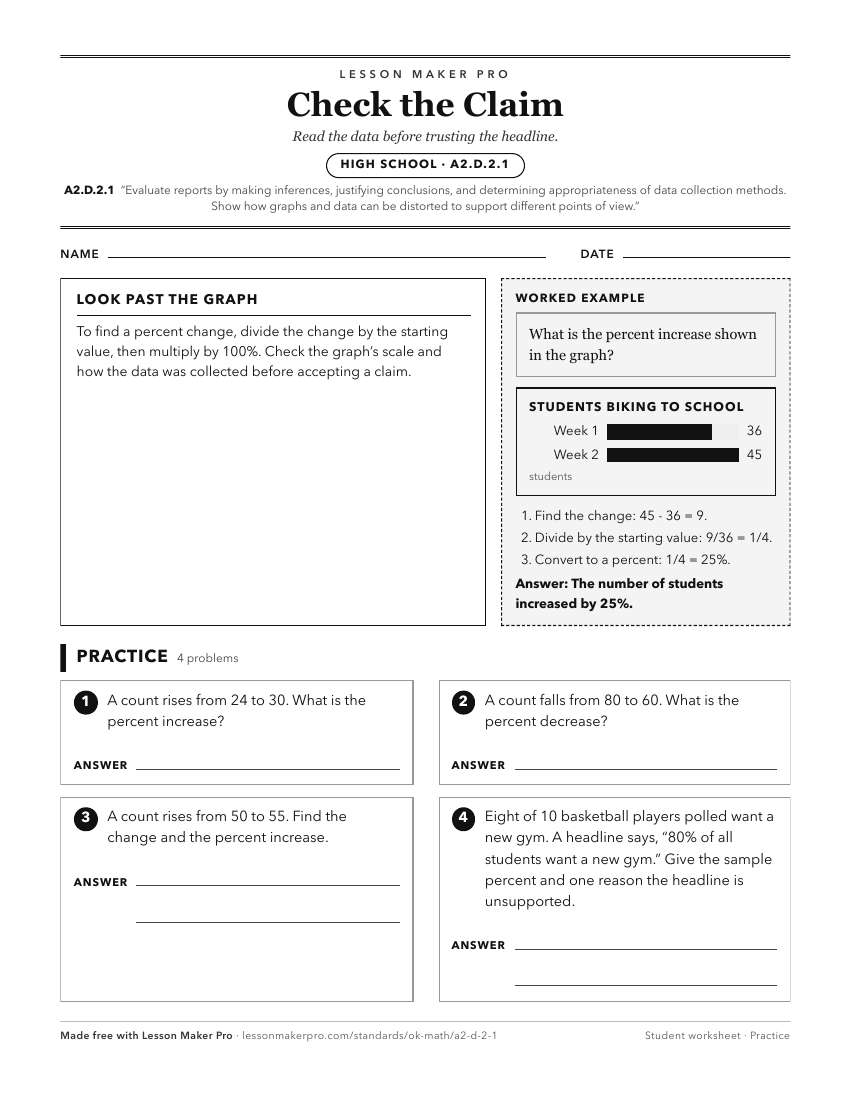
A ready-to-print activity worksheet aligned to A2.D.2.1, with an answer key for the teacher on its own page. No account needed.
PDF, US Letter, prints cleanly in black and white.
Download the worksheetKeep exploring
Related Standards
- A2.D.2.2
Identify and explain misleading conclusions and graphical representations of data sets.
- A2.D.2
Analyze statistical thinking to draw inferences, make predictions, and justify conclusions.
- S.DA.5
Make statistical inferences and evaluate claims from studies.
- 7.D.1
Interpret and analyze data, creating the most appropriate display, using a variety of tools.
Turn this exact standard into a lesson
Grade, subject, topic, and the complete standard are prefilled. Create one free, no account needed.
Also for this standard:Make a WorksheetMake a QuizMake a Sub Lesson