Oklahoma Math S.DA.4
Standard Cluster
Analyze associations between two variables. Create two-way tables for bivariate categorical data and analyze for possible associations between the two categories using marginal, joint, and conditional frequencies. Make predictions and draw conclusions from regression models (linear, exponential, quadratic) from two-variable quantitative data. Analyze scatter plots for patterns, linearity, outliers, and influential points. Using technology, compute and interpret the correlation coefficient. Understand the implications of extrapolating data to make predictions.
Oklahoma Academic Standards for Mathematics (2022)
Cluster contents
Standards in This Cluster
S.DA.4 is a cluster heading. These are the individual standards under it.
- S.DA.4.1
Create two-way tables for bivariate categorical data and analyze for possible associations between the two categories using marginal, joint, and conditional fre...
- S.DA.4.2
Make predictions and draw conclusions from regression models (linear, exponential, quadratic) from two-variable quantitative data.
- S.DA.4.3
Analyze scatter plots for patterns, linearity, outliers, and influential points.
- S.DA.4.4
Using technology, compute and interpret the correlation coefficient.
- S.DA.4.5
Understand the implications of extrapolating data to make predictions.
How Oklahoma's version differs
Oklahoma combines the two-variable work of HSS-ID.B with the technology-based correlation work of HSS-ID.C.8 and explicitly adds influential-point analysis and extrapolation cautions, while not explicitly requiring the residual analysis specified in HSS-ID.B.6b.
Teacher's field guide
What This Cluster Means
What Students Need to Do
- Students make two-way tables and find cell counts, totals, and within-group rates. They check scatter plots for patterns and unusual points, then fit linear, exponential, or quadratic models. They interpret correlation and make predictions, with care outside the observed data.
What Mastery Looks Like
- A student uses the right denominator for joint, marginal, and conditional frequencies. They choose a model that fits a scatter plot, flag points that change the fit, and explain predictions in context. They use technology to find correlation, describe a linear pattern's strength and direction, and question predictions outside the data.
Common Misconceptions
- Students may divide by the grand total when asked for a within-group rate. They may treat correlation as proof of cause or use it to judge a curved pattern. They may call every outlier influential or trust a model far beyond the measured values.
How to Assess It
- Exit ticket: Give students a fitted line, sales = 5 × temperature + 20, for temperatures from 15°C to 35°C, with r = 0.8. Ask for predicted sales at 25°C, what r suggests, and why a prediction at 50°C is risky.
Lesson moves
Ways to Teach It
Hand out 20 cards showing lunch choice and club membership; students sort them into a two-way table and compare club rates by lunch choice.
Display a scatter plot with one far-right point; ask students to explain whether removing it might change the fitted line.
In pairs, match six scatter plots to linear, exponential, or quadratic equations, then use a graphing tool to check each match.
Give students a table of ice cream sales at 15°C to 35°C; have them predict sales at 25°C and 50°C.
Free download
Printable S.DA.4 Worksheet
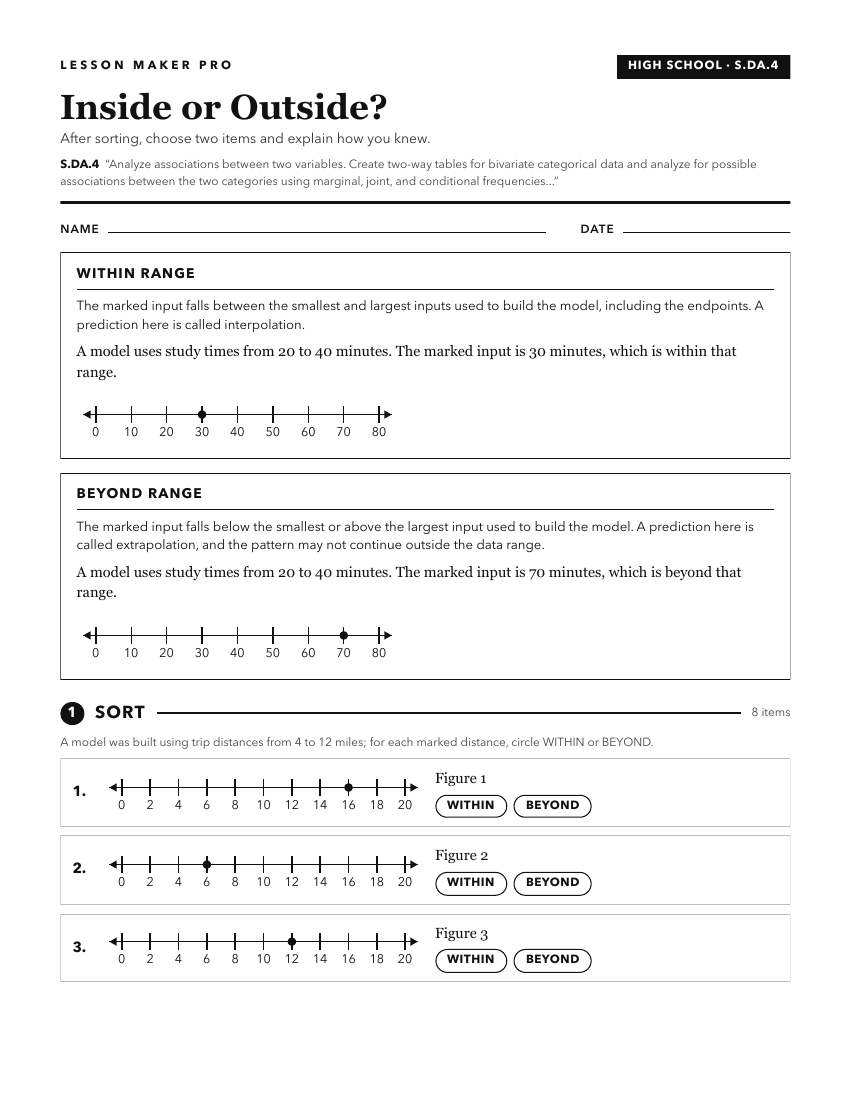
A ready-to-print activity worksheet aligned to S.DA.4, with an answer key for the teacher on its own page. No account needed.
PDF, US Letter, prints cleanly in black and white.
Download the worksheetKeep exploring
Related Standards
Turn this cluster into a lesson
Grade, subject, topic, and the complete cluster are prefilled. Create one free, no account needed.
Also for this cluster:Make a WorksheetMake a QuizMake a Sub Lesson