Oklahoma Math S.DA.4.5
The Standard
- S.DA.4
- Analyze associations between two variables.
Understand the implications of extrapolating data to make predictions.
Oklahoma Academic Standards for Mathematics (2022)
Teacher's field guide
What This Standard Means
What Students Need to Do
- Students identify when a prediction goes beyond the values in a data set. They can extend a trend to make an estimate, then explain why that estimate may be less reliable.
What Mastery Looks Like
- A student sees that 110°F is outside a recorded range of 60°F to 90°F and uses the trend to estimate sales. They explain that sales may not keep rising in extreme heat.
Common Misconceptions
- Students may think a straight line will continue forever. They may trust a prediction outside the recorded range as much as one inside it.
How to Assess It
- Exit ticket: A shop sold 20, 30, 40, and 50 cones at 60°F, 70°F, 80°F, and 90°F. Predict sales at 110°F and explain why the prediction may be unreliable.
Lesson moves
Ways to Teach It
Plot (60,20), (70,30), (80,40), and (90,50) for temperature and cones sold; extend the line to 110°F with a ruler.
Have students write why a prediction for cone sales at 85°F deserves more trust than one at 110°F.
Give students cards marked 75°F, 85°F, 100°F, and 110°F; have them sort predictions inside or outside the 60°F to 90°F data range.
Show a 110°F weather forecast and have students decide whether a cone shop should order 70 cones using only sales from 60°F to 90°F.
Free download
Printable S.DA.4.5 Worksheet
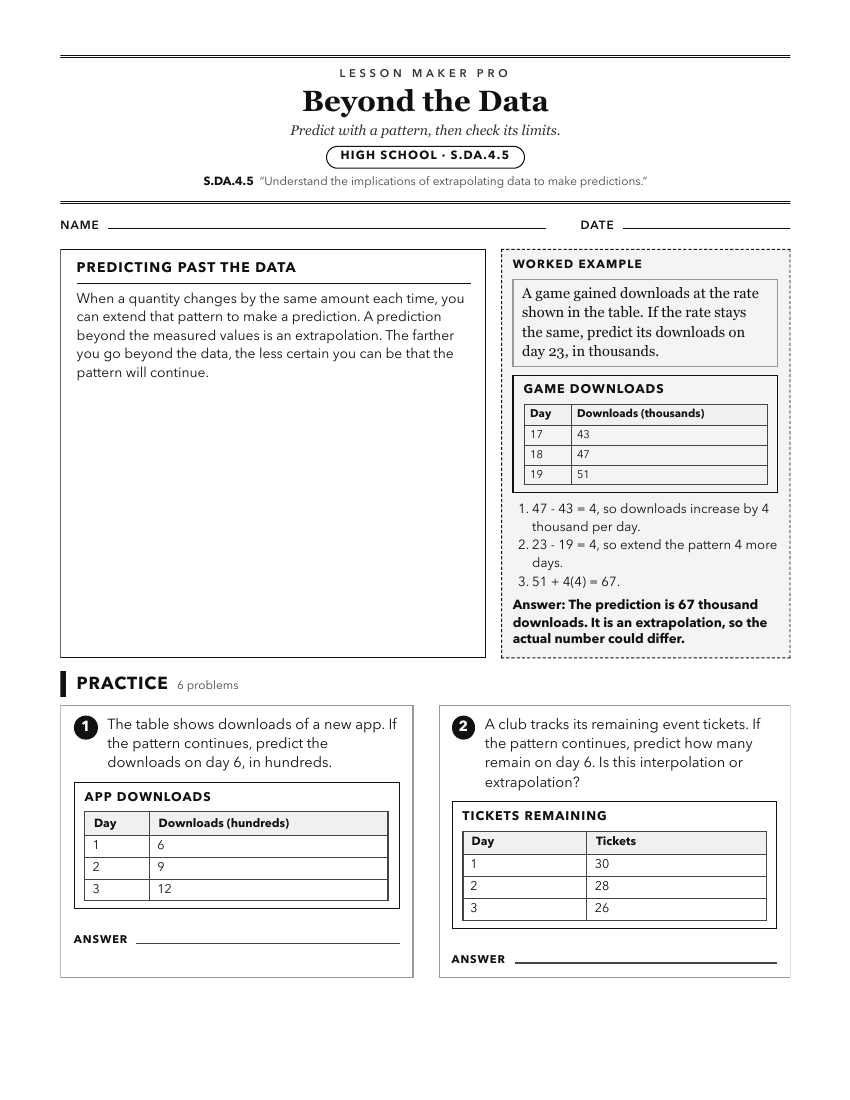
A ready-to-print activity worksheet aligned to S.DA.4.5, with an answer key for the teacher on its own page. No account needed.
PDF, US Letter, prints cleanly in black and white.
Download the worksheetKeep exploring
Related Standards
- S.DA.4.2
Make predictions and draw conclusions from regression models (linear, exponential, quadratic) from two-variable quantitative data.
- S.IR.1.3
Develop inferences or predictions to construct resulting decisions or recommendations.
- S.DC.1.3
Determine the appropriate scope of inference for generalizing results.
- PA.D.1
Display and interpret data in a variety of ways, including using scatter plots and approximate lines of best fit. Use the line of best fit and average rate of c...
Turn this exact standard into a lesson
Grade, subject, topic, and the complete standard are prefilled. Create one free, no account needed.
Also for this standard:Make a WorksheetMake a QuizMake a Sub Lesson