Oklahoma Math PA.D.2
Standard Cluster
Calculate experimental probabilities and reason about probabilities to model and solve problems. Calculate experimental probabilities and represent them as percents, fractions, and decimals between 0 and 1. Use experimental probabilities to predict relative frequencies when actual probabilities are unknown. Determine how samples are chosen (randomness) to draw and support conclusions about generalizing a sample to a population, including identifying limitations and biases. Define, compare, and contrast the probabilities of dependent and independent events.
Oklahoma Academic Standards for Mathematics (2022)
Cluster contents
Standards in This Cluster
PA.D.2 is a cluster heading. These are the individual standards under it.
- PA.D.2.1
Calculate experimental probabilities and represent them as percents, fractions, and decimals between 0 and 1. Use experimental probabilities to predict relative...
- PA.D.2.2
Determine how samples are chosen (randomness) to draw and support conclusions about generalizing a sample to a population, including identifying limitations and...
- PA.D.2.3
Define, compare, and contrast the probabilities of dependent and independent events.
Teacher's field guide
What This Cluster Means
What Students Need to Do
- Students use trial results to find probabilities as fractions, decimals, and percents. They use those results to predict counts when the true chance is unknown. They check whether a sample represents a larger group and whether one event changes the chance of another.
What Mastery Looks Like
- Given 9 red draws in 30 trials, a student reports 3/10, 0.3, and 30%, then predicts about 60 red draws in 200 trials. They explain why surveying one lunch period may not represent the whole school. They identify marble draws without replacement as dependent and draws with replacement as independent.
Common Misconceptions
- Students may read 18 successes in 50 trials as 18% instead of 36%. They may treat a predicted count as exact or assume a large sample is representative even if it was not chosen randomly. They may call two draws independent when the first marble is not replaced.
How to Assess It
- Exit ticket: In 50 draws with replacement, 18 are red. Write the experimental probability as a fraction, decimal, and percent, predict red draws in 200, then explain whether two draws without replacement would be dependent.
Lesson moves
Ways to Teach It
Give pairs a bag of 3 red and 2 blue cubes; have them draw 30 times with replacement and record red draws.
Ask students to write why surveying only the first 20 students in a lunch line might misrepresent the whole school.
Play a card-sort race matching 12/40, 0.3, and 30%, then sort marble draws with and without replacement by dependence.
Tell students that 25 of 100 randomly surveyed classmates ride the bus; have them estimate bus riders in a school of 800.
Free download
Printable PA.D.2 Worksheet
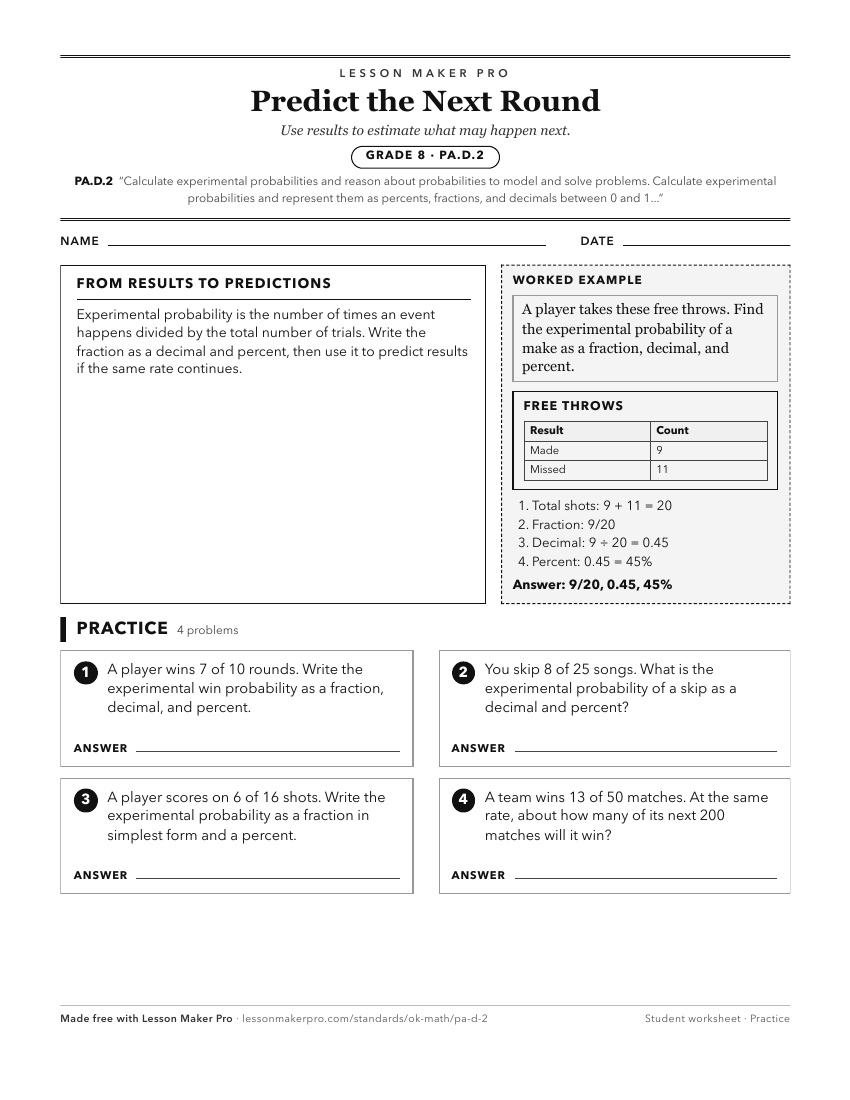
A ready-to-print activity worksheet aligned to PA.D.2, with an answer key for the teacher on its own page. No account needed.
PDF, US Letter, prints cleanly in black and white.
Download the worksheetKeep exploring
Related Standards
Turn this cluster into a lesson
Grade, subject, topic, and the complete cluster are prefilled. Create one free, no account needed.
Also for this cluster:Make a WorksheetMake a QuizMake a Sub Lesson