Oklahoma Math 7.D.2
Standard Cluster
Calculate and use proportional reasoning with probabilities to model and solve mathematical problems. Determine the theoretical probability of an event using the ratio between the size of the event and the size of the sample space; represent probabilities as percents, fractions and decimals between 0 and 1. Calculate probability as a fraction of sample space or as a fraction of area. Express probabilities as percents, decimals, and fractions. Use proportional reasoning to draw conclusions about and predict relative frequencies of outcomes based on theoretical probabilities.
Oklahoma Academic Standards for Mathematics (2022)
Cluster contents
Standards in This Cluster
7.D.2 is a cluster heading. These are the individual standards under it.
- 7.D.2.1
Determine the theoretical probability of an event using the ratio between the size of the event and the size of the sample space; represent probabilities as per...
- 7.D.2.2
Calculate probability as a fraction of sample space or as a fraction of area. Express probabilities as percents, decimals and fractions.
- 7.D.2.3
Use proportional reasoning to draw conclusions about and predict relative frequencies of outcomes based on theoretical probabilities.
Teacher's field guide
What This Cluster Means
What Students Need to Do
- Students find the part of a set or area that matches an event. They write its probability as a fraction, decimal, and percent. They use that probability to predict how often the event might happen.
What Mastery Looks Like
- Given a spinner with 3 equal blue sections out of 10, a student gives 3/10, 0.3, and 30% for blue. They predict about 15 blue results in 50 spins and know the actual count may differ. They can also find probability from a shaded area.
Common Misconceptions
- Students may count sections without noticing that some are larger than others. They may write 3/10 as 3% instead of 30%. They may expect exactly 15 blue results in 50 spins rather than about 15.
How to Assess It
- Show a 4-by-5 grid with six squares shaded. Ask: If a point lands randomly on the grid, what is the chance it lands on shading as a fraction, decimal, and percent? About how many hits would you expect in 50 tries?
Lesson moves
Ways to Teach It
Make a spinner with ten equal sections, color three blue, spin it 30 times, and compare the blue count with the predicted nine.
Draw a spinner with one red half and two blue quarters; ask why counting sections gives the wrong probability for red.
Give pairs cards showing shaded grids, fractions, decimals, and percents; have them match each grid to its three equivalent probabilities.
Show a bag with four red and six blue prize tickets; ask how many red draws to expect in 50 draws with replacement.
Free download
Printable 7.D.2 Worksheet
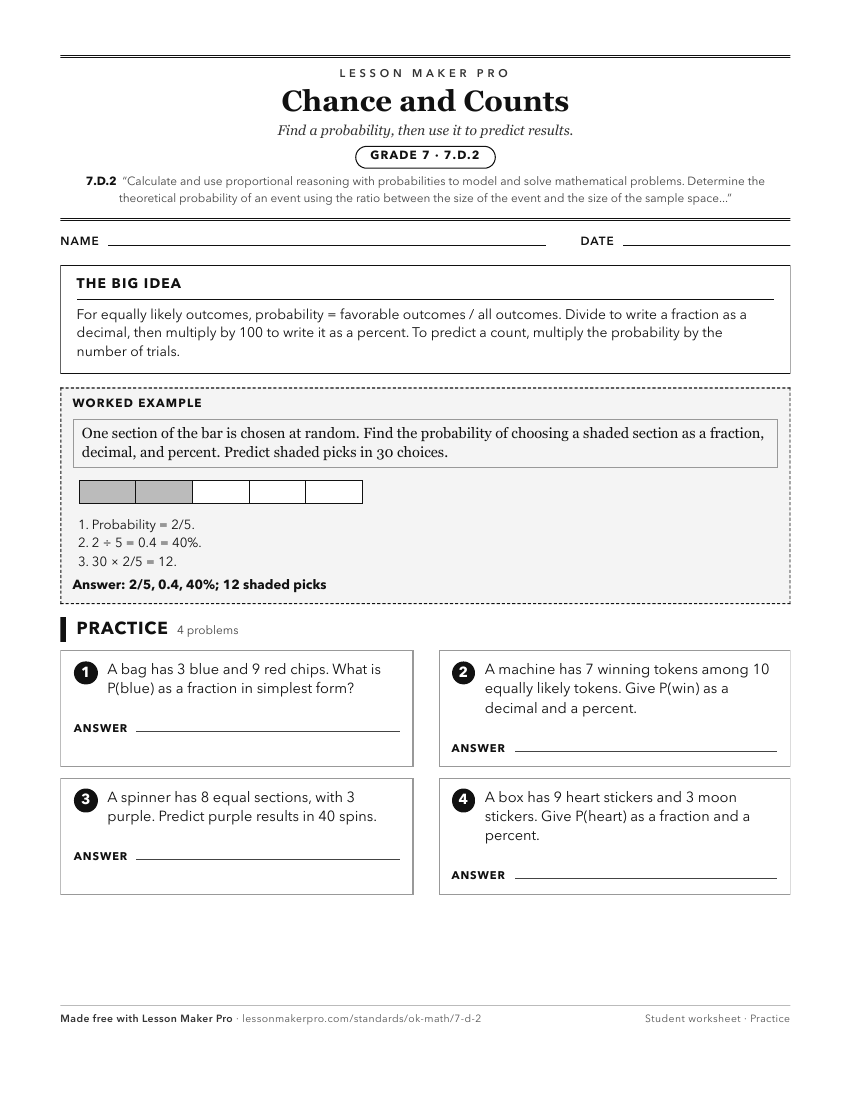
A ready-to-print activity worksheet aligned to 7.D.2, with an answer key for the teacher on its own page. No account needed.
PDF, US Letter, prints cleanly in black and white.
Download the worksheetKeep exploring
Related Standards
- 7.GM.3
Use mathematical models and reasoning with proportions and ratios to determine measurements, justify formulas, and solve problems.
- PA.D.2
Calculate experimental probabilities and reason about probabilities to model and solve problems.
- 6.D.2
Use probability to model and solve mathematical problems; represent probabilities using fractions and decimals.
- 7.A.2.3
Use proportional reasoning to solve problems involving ratios.
Turn this cluster into a lesson
Grade, subject, topic, and the complete cluster are prefilled. Create one free, no account needed.
Also for this cluster:Make a WorksheetMake a QuizMake a Sub Lesson