Oklahoma Math A1.D.2
Standard Cluster
Calculate probabilities, and apply probability concepts. Apply simple counting procedures (factorials, permutations, combinations, and tree diagrams) to determine sample size, sample space, and calculate probabilities. Given a Venn diagram, determine the probability of the union of events, the intersection of events, and the complement of an event. Understand the relationships between these concepts and the words “AND,” “OR,” and “NOT.” Use simulations and experiments to calculate experimental probabilities. Apply probability concepts to real-world situations to make informed decisions.
Oklahoma Academic Standards for Mathematics (2022)
Cluster contents
Standards in This Cluster
A1.D.2 is a cluster heading. These are the individual standards under it.
- A1.D.2.1
Apply simple counting procedures (factorials, permutations, combinations, and tree diagrams) to determine sample size, sample space, and calculate probabilities...
- A1.D.2.2
Given a Venn diagram, determine the probability of the union of events, the intersection of events, and the complement of an event. Understand the relationships...
- A1.D.2.3
Use simulations and experiments to calculate experimental probabilities.
- A1.D.2.4
Apply probability concepts to real-world situations to make informed decisions.
Teacher's field guide
What This Cluster Means
What Students Need to Do
- Students count possible outcomes using tree diagrams, factorials, permutations, and combinations. They use those counts to find probabilities and read Venn diagrams to find AND, OR, and NOT probabilities. They run trials or simulations and use the results to make a choice.
What Mastery Looks Like
- A student can tell when order matters and choose a counting method that fits. They find OR probabilities without counting the overlap twice, and they identify the regions for AND and NOT. They compare calculated probabilities with trial results before making a choice.
Common Misconceptions
- Students may use permutations when order does not matter, or leave out outcomes when drawing a tree. They may count the overlap twice for OR or count inside a circle for NOT. They may expect a small set of trials to match the calculated probability exactly.
How to Assess It
- Exit ticket: In a class of 30, 12 play soccer, 10 play chess, and 4 do both. Draw a Venn diagram and find the probability that a student plays soccer OR chess, plays both, and plays neither.
Lesson moves
Ways to Teach It
Give pairs two dice and a tally sheet; roll 30 times, record sums, and compare the frequency of 7 with its calculated probability.
Ask students to explain why arranging five books uses 5!, but selecting two books uses a combination.
Give teams event cards; have them shade AND, OR, or NOT on a Venn diagram and check each other's work.
Compare two $1 raffles, one with 3 winning tickets out of 100 and one with 1 out of 50; choose the better chance.
Free download
Printable A1.D.2 Worksheet
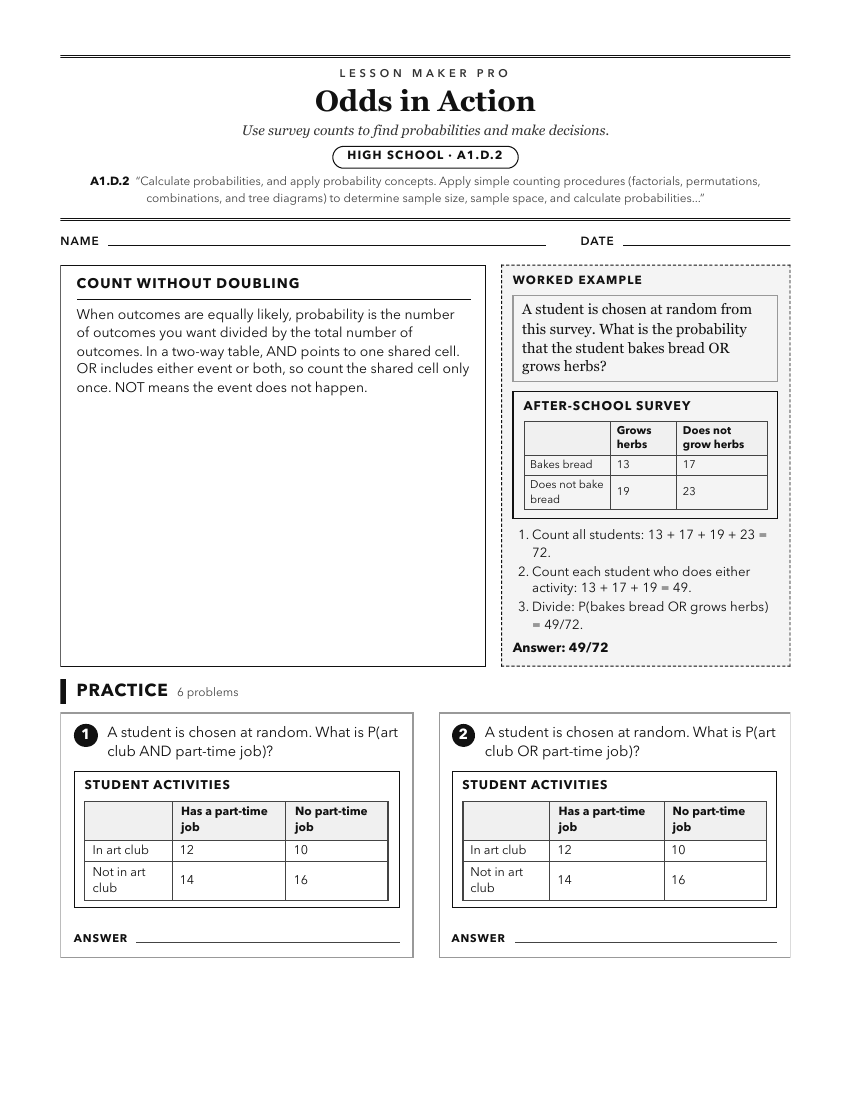
A ready-to-print activity worksheet aligned to A1.D.2, with an answer key for the teacher on its own page. No account needed.
PDF, US Letter, prints cleanly in black and white.
Download the worksheetKeep exploring
Related Standards
Turn this cluster into a lesson
Grade, subject, topic, and the complete cluster are prefilled. Create one free, no account needed.
Also for this cluster:Make a WorksheetMake a QuizMake a Sub Lesson