NY Next Generation Math AII-S.IC.4
The Standard
Given a simulation model based on a sample proportion or mean, construct the 95% interval centered on the statistic (+/-two standard deviations) and determine if a suggested parameter is plausible.
New York State Next Generation Mathematics Learning Standards
Teacher's field guide
What This Standard Means
What Students Need to Do
- Students construct a 95 percent interval around a simulated sample proportion or mean using two standard deviations. They decide whether a proposed population parameter is plausible under the model.
What Mastery Looks Like
- The student calculates both interval endpoints correctly and places the suggested parameter relative to them. The conclusion states plausible or not plausible with the simulation as evidence.
Common Misconceptions
- Students may center the interval on the proposed parameter instead of the simulated statistic. They may add two variances rather than two standard deviations.
How to Assess It
- Provide a simulated statistic, its standard deviation, and a proposed parameter. Ask for the 95 percent interval and a one-sentence plausibility conclusion.
Lesson moves
Ways to Teach It
Mark a statistic on a number line and extend two standard-deviation strips in both directions.
Ask why the interval is centered on the simulation statistic in this course procedure.
Play interval checkpoint with endpoint calculations and parameter cards to place inside or outside.
Evaluate whether a claimed customer approval rate is plausible from a simulation summary.
Free download
Printable AII-S.IC.4 Worksheet
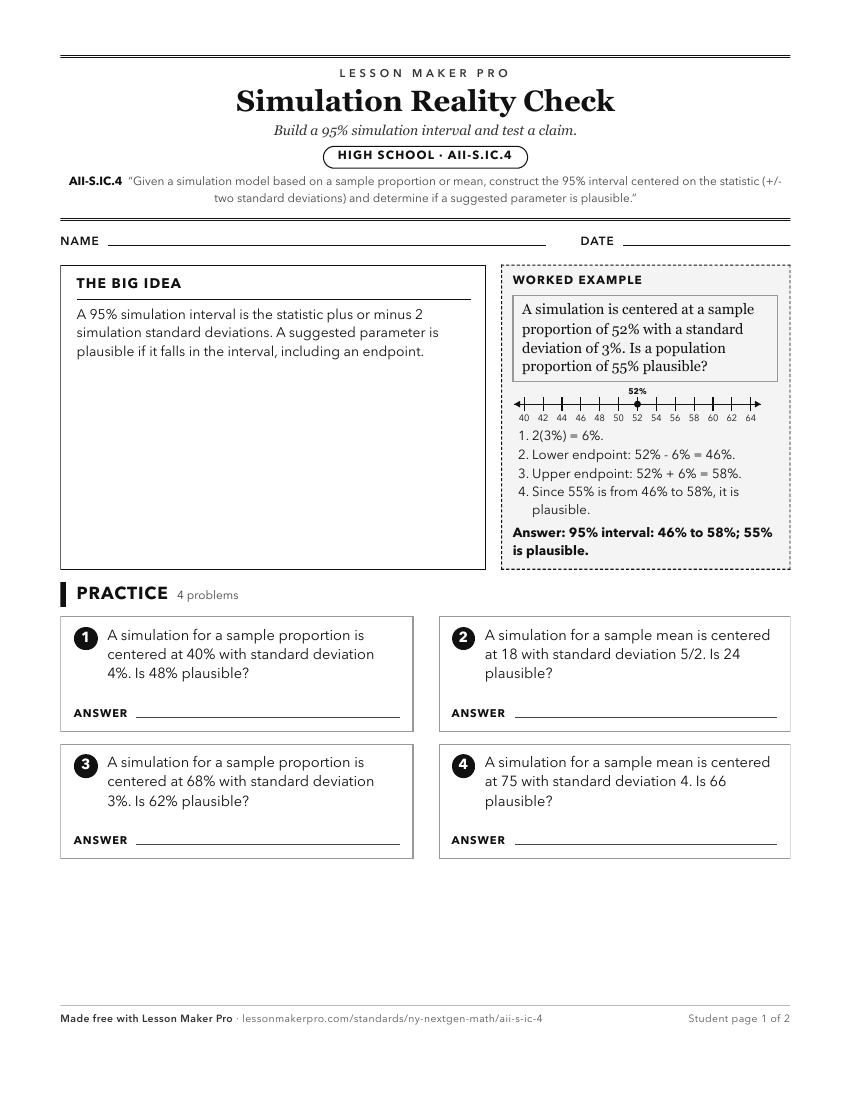
A ready-to-print activity worksheet aligned to AII-S.IC.4, with an answer key for the teacher on its own page. No account needed.
PDF, US Letter, prints cleanly in black and white.
Download the worksheetKeep exploring
Related Standards
- NY-6.SP.8
Develop a probability model and use it to find probabilities of simple events. Compare probabilities from a model to observed frequencies; if the agreement is n...
- NY-6.SP.1.c
Understand that the method and sample size used to collect data for a particular question is intended to reduce the difference between a population and a sample...
- NY-6.SP.8.b
Develop a probability model (which may not be uniform) by observing frequencies in data generated from a chance process
- AII-S.IC.2
Determine if a value for a sample proportion or sample mean is likely to occur based on a given simulation.
Turn this exact standard into a lesson
Grade, subject, topic, and the complete standard are prefilled. Create one free, no account needed.
Also for this standard:Make a WorksheetMake a QuizMake a Sub Lesson