Montana Math MT.PLUS.DATA.INF.3.a
The Standard
- MT.PLUS.DATA.INF.3
- Use data from a randomized experiment to test the hypothesis that two groups are equal by: Interpreting the difference or ratio between the group means as the observed effect between the groups, and Understanding that an observed effect may be due to randomization and using a randomization test (repeatedly reshuffling the observed data into new groups) to determine the probability that an observed effect is due to randomization alone.
Use data from a randomized experiment to test the hypothesis that two groups are equal by: Interpreting the difference or ratio between the group means as the observed effect between the groups, and
2026 Montana Mathematics Content Standards · Data Reasoning
Teacher's field guide
What This Standard Means
What Students Need to Do
- Students find the mean outcome for each randomly assigned group. They use the difference or ratio of the means to describe the observed effect. They check whether a gap that large could happen by chance if the groups were equal.
What Mastery Looks Like
- A student calculates both means and reports the difference with its units, or a ratio without units. They name which group had the higher mean and use shuffled group labels to judge whether the gap is unusual.
Common Misconceptions
- Students may compare group sizes instead of mean outcomes. They may call any nonzero gap proof that a treatment works, even when shuffled groups often show gaps that large. Some mistake a ratio of 1 for a difference of 1, rather than no observed gap.
How to Assess It
- Exit ticket: Randomly assigned groups using methods A and B averaged 12 and 15 minutes to finish a task. Only 4 of 100 shuffled assignments had gaps of at least 3 minutes. Find B minus A and say whether that gap looks common if the methods are equal.
Lesson moves
Ways to Teach It
Make 12 paper helicopters, randomly assign six to long blades and six to short blades, time each drop, and compare mean times.
After random assignment, group A averaged 2 seconds and group B 3 seconds; write the difference, ratio, and what each means.
Shuffle 12 drop-time cards into two groups of six 30 times, recording how often the mean gap matches or exceeds the original gap.
Show an A/B test where randomly assigned shoppers averaged 48 or 55 seconds at checkout; ask whether the seven-second gap proves one layout works.
Free download
Printable MT.PLUS.DATA.INF.3.a Worksheet
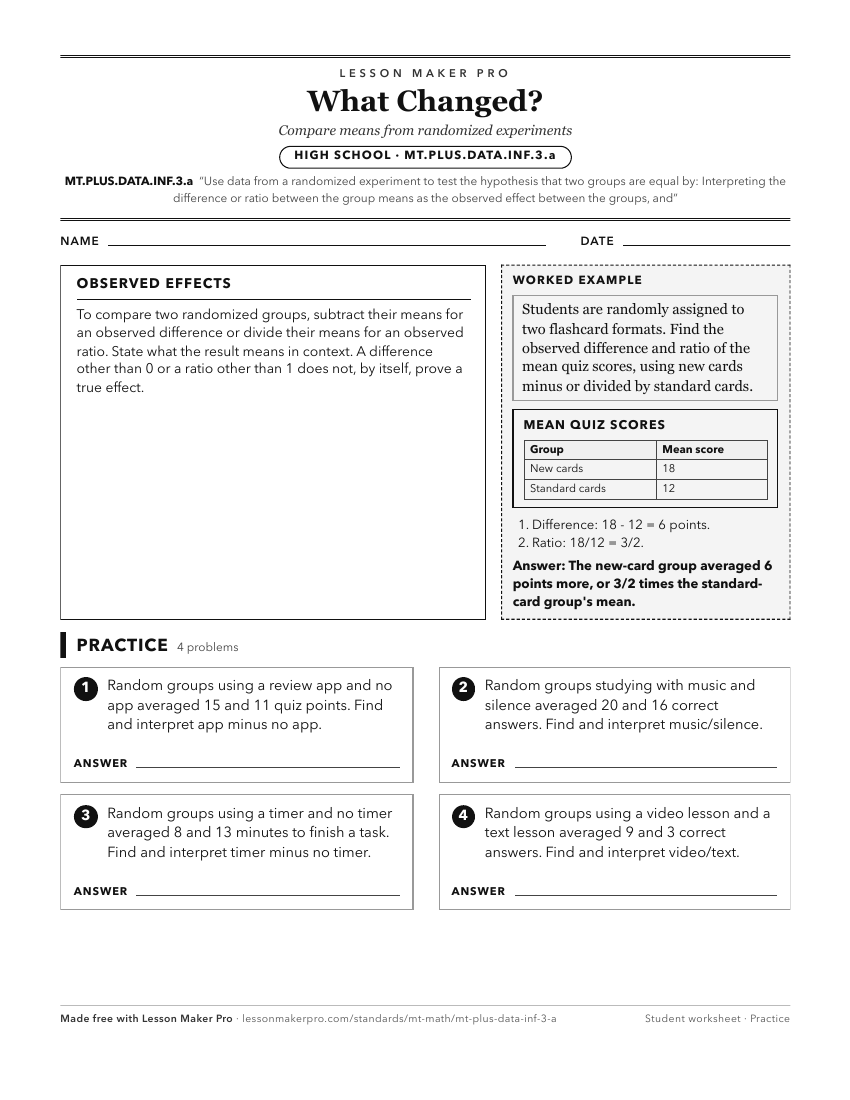
A ready-to-print activity worksheet aligned to MT.PLUS.DATA.INF.3.a, with an answer key for the teacher on its own page. No account needed.
PDF, US Letter, prints cleanly in black and white.
Download the worksheetKeep exploring
Related Standards
- MT.PLUS.DATA.INF.3.b
Understanding that an observed effect may be due to randomization and using a randomization test (repeatedly reshuffling the observed data into new groups) to d...
- MT.CORE.DATA.INT.7.b
Interpreting relative frequencies for categorical data in context, and
- MT.CORE.DATA.INT.4
Interpret differences in the shape, center, and spread of quantitative data distributions, in context, accounting for possible effects of outliers on measures o...
- MT.PLUS.DATA.INF.3
Use data from a randomized experiment to test the hypothesis that two groups are equal by: Interpreting the difference or ratio between the group means as the o...
Turn this exact standard into a lesson
Grade, subject, topic, and the complete standard are prefilled. Create one free, no account needed.
Also for this standard:Make a WorksheetMake a QuizMake a Sub Lesson