Montana Math MT.CORE.DATA.INT.7.b
The Standard
- MT.CORE.DATA.INT.7
- Analyze the relationship between two categorical variables in context. This standard should incorporate cultural context relating to Montana Indigenous Peoples and local communities by: Summarizing categorical data for two categories in two-way frequency tables and visual representations, Interpreting relative frequencies for categorical data in context, and Identifying possible associations and trends in categorical data.
Analyze the relationship between two categorical variables in context. This standard should incorporate cultural context relating to Montana Indigenous Peoples and local communities by: Interpreting relative frequencies for categorical data in context, and
2026 Montana Mathematics Content Standards · Data Reasoning and Probability
Teacher's field guide
What This Standard Means
What Students Need to Do
- Students read a two-way table about a local community survey. They calculate the percent in each group who gave a particular answer, then compare those percents in context.
What Mastery Looks Like
- In a fictional survey about a public talk by a Montana tribal historian, 12 of 20 people who heard by flyer and 30 of 40 who heard online plan to attend. A student finds 60% and 75%, then says the online group has a higher share without claiming the notice caused the difference.
Common Misconceptions
- Students compare 12 with 30 without noticing that the groups have different sizes. They may divide by all 60 people instead of each group's total, or claim the way people heard about the talk caused their plans.
How to Assess It
- Give students the fictional survey counts: flyer, 12 plan to attend and 8 do not; online, 30 plan to attend and 10 do not. Ask them to find both within-group percents, compare them, and name one claim the data cannot support.
Lesson moves
Ways to Teach It
Use two colors of counters to build a table: flyer, 12 yes and 8 no; online, 30 yes and 10 no.
Ask, 'Why is 30 versus 12 a misleading comparison here, and does the outreach method cause anyone to attend?'
Play denominator match: put 12/20, 30/40, 12/60, and 30/60 on cards; teams choose fractions that compare attendance plans by outreach method.
Show a public Montana tribal college event flyer; students write 'How did you hear?' and 'Do you plan to attend?' for an anonymous survey.
Free download
Printable MT.CORE.DATA.INT.7.b Worksheet
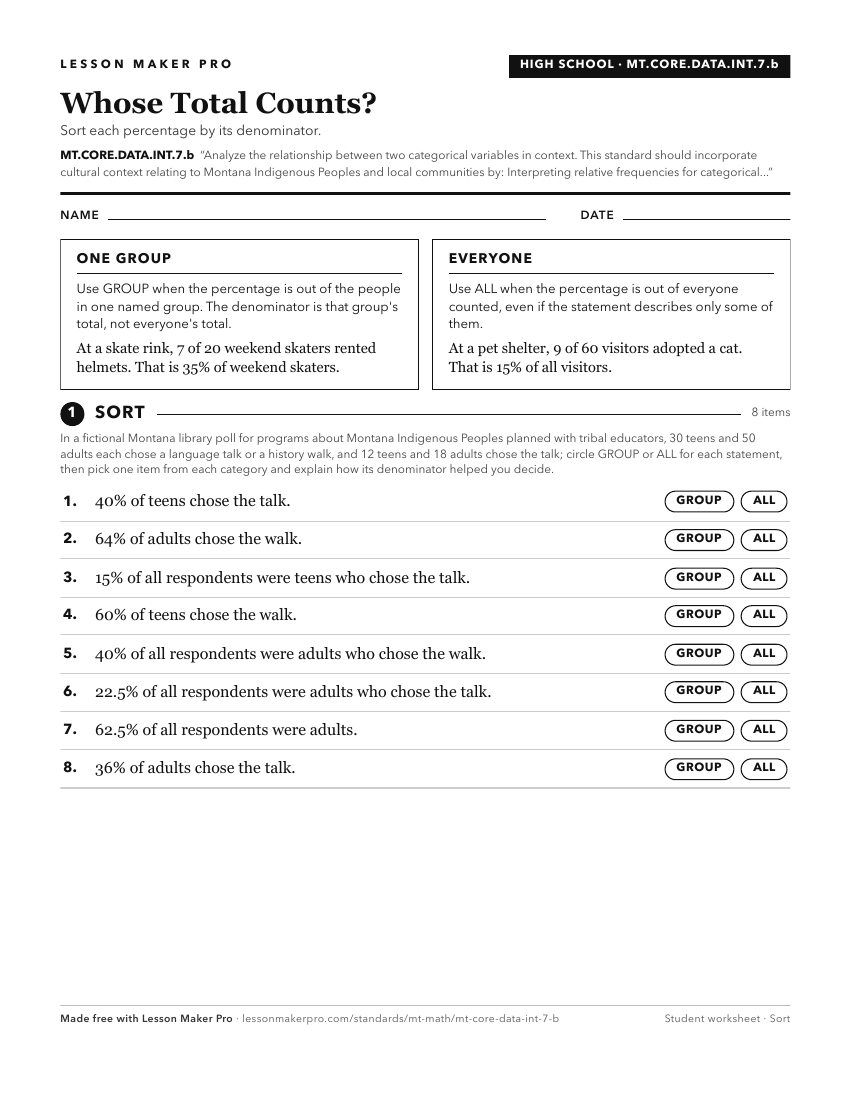
A ready-to-print activity worksheet aligned to MT.CORE.DATA.INT.7.b, with an answer key for the teacher on its own page. No account needed.
PDF, US Letter, prints cleanly in black and white.
Download the worksheetKeep exploring
Related Standards
- MT.CORE.DATA.INT.7.a
Summarizing categorical data for two categories in two-way frequency tables and visual representations,
- MT.CORE.DATA.INT.7
Analyze the relationship between two categorical variables in context. This standard should incorporate cultural context relating to Montana Indigenous Peoples ...
- MT.CORE.DATA.INT.7.c
Identifying possible associations and trends in categorical data.
- MT.8.SP.4
Construct and interpret frequencies and relative frequencies for bivariate categorical data in a two-way table to investigate patterns of association. This stan...
Turn this exact standard into a lesson
Grade, subject, topic, and the complete standard are prefilled. Create one free, no account needed.
Also for this standard:Make a WorksheetMake a QuizMake a Sub Lesson