Montana Math MT.8.SP.4
The Standard
Construct and interpret frequencies and relative frequencies for bivariate categorical data in a two-way table to investigate patterns of association. This standard should incorporate cultural context relating to Montana Indigenous Peoples and local communities.
2026 Montana Mathematics Content Standards
Teacher's field guide
What This Standard Means
What Students Need to Do
- Students sort fictional survey responses about Crow Fair, a Crow Tribe event, and a county fair by event choice and preferred information source. They count each pair of responses, calculate percentages within each event group, and compare the percentages for a pattern.
What Mastery Looks Like
- A student puts each response in the right cell of a two-way table and totals the rows. They calculate that 12 of 20 Crow Fair respondents chose flyers, or 60%, compared with 6 of 20 county fair respondents, or 30%. They describe a possible association without claiming that event choice caused the difference.
Common Misconceptions
- Students may divide by the total number surveyed instead of the total for one event group. They may compare raw counts when the groups are different sizes, or assume that choosing Crow Fair reveals someone's tribal identity.
How to Assess It
- Give students a table with 9 Crow Fair respondents choosing flyers and 6 choosing websites, plus 12 county fair respondents choosing flyers and 28 choosing websites. Ask: What percent of each event group chose flyers, and what pattern do you see?
Lesson moves
Ways to Teach It
Give pairs 40 fictional response cards: 12 Crow Fair/flyer, 8 Crow Fair/website, 6 county fair/flyer, and 14 county fair/website; have them sort and tally.
Ask: Do different flyer percentages show that event choice causes information preference? Have students explain their answer in two sentences.
Post the claim that 12 county fair respondents choosing flyers beats 9 Crow Fair respondents; pairs challenge it using row percentages.
Show a public Crow Fair flyer and a county fair flyer; students draft two anonymous survey questions about event interest and information-source preference.
Free download
Printable MT.8.SP.4 Worksheet
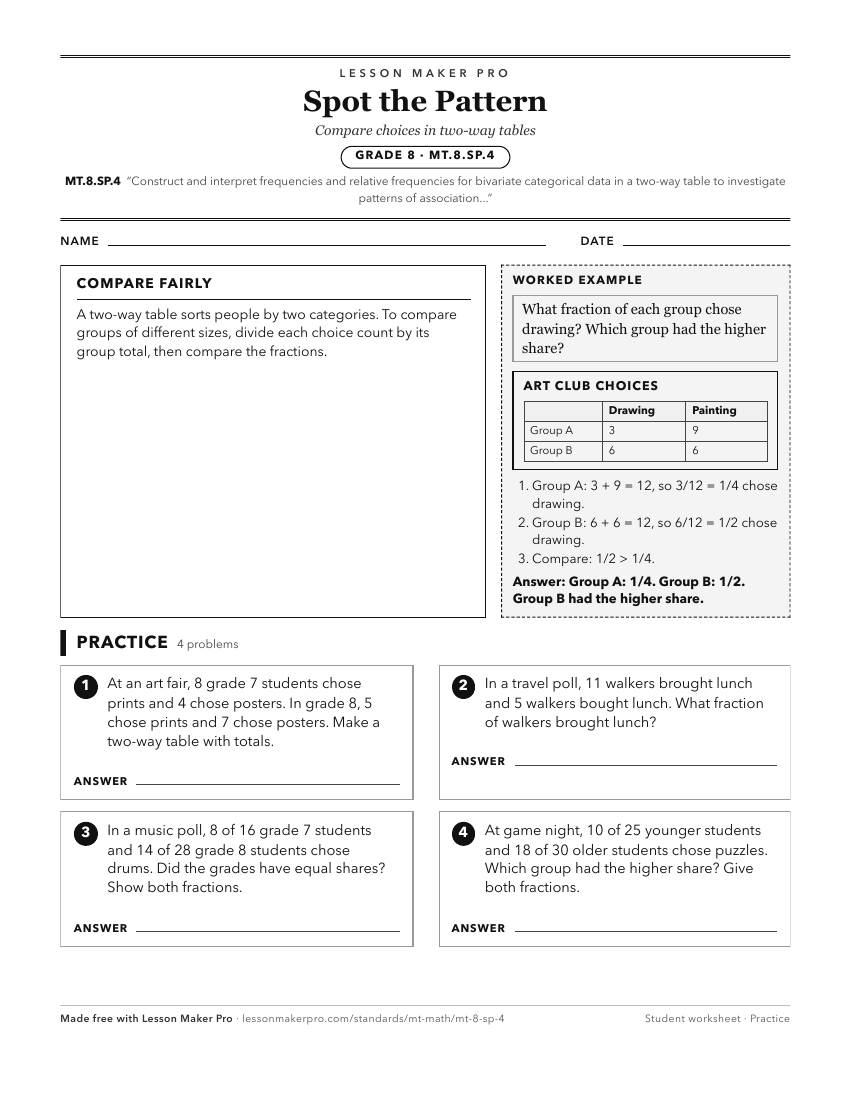
A ready-to-print activity worksheet aligned to MT.8.SP.4, with an answer key for the teacher on its own page. No account needed.
PDF, US Letter, prints cleanly in black and white.
Download the worksheetKeep exploring
Related Standards
- MT.K.MD.3
Classify, count, and sort objects into categories. This standard should incorporate cultural context relating to Montana Indigenous Peoples and local communitie...
- MT.6.EE.8
Use variables to represent two quantities that change in relationship to one another, analyze the relationship between the dependent and independent variables u...
- MT.2.MD.9
Generate measurement data and present the data in multiple ways. This standard should incorporate cultural context relating to Montana Indigenous Peoples and lo...
- MT.2.MD.10
Organize, represent, and interpret data with up to four categories. This standard should incorporate cultural context relating to Montana Indigenous Peoples and...
Turn this exact standard into a lesson
Grade, subject, topic, and the complete standard are prefilled. Create one free, no account needed.
Also for this standard:Make a WorksheetMake a QuizMake a Sub Lesson