Montana Math MT.CORE.DATA.INT.7.c
The Standard
- MT.CORE.DATA.INT.7
- Analyze the relationship between two categorical variables in context. This standard should incorporate cultural context relating to Montana Indigenous Peoples and local communities by: Summarizing categorical data for two categories in two-way frequency tables and visual representations, Interpreting relative frequencies for categorical data in context, and Identifying possible associations and trends in categorical data.
Analyze the relationship between two categorical variables in context. This standard should incorporate cultural context relating to Montana Indigenous Peoples and local communities by: Identifying possible associations and trends in categorical data.
2026 Montana Mathematics Content Standards · Data Reasoning and Probability
Teacher's field guide
What This Standard Means
What Students Need to Do
- Students sort paired category labels into a two-way table. They compare percentages within each group, describe any pattern, and explain what the data cannot show.
What Mastery Looks Like
- Given event listings from a tribal college and a town library, students find the share of Indigenous language events for each host. They describe the difference without claiming it shows what community members value or what caused it.
Common Misconceptions
- Students may compare 12 language events at the library with 8 at the college without checking the total number of events at each host. They may treat an event calendar as a survey of community views or mistake an association for a cause.
How to Assess It
- A fictional calendar lists 8 Indigenous language events and 2 other events at a tribal college, and 12 language events and 18 other events at a town library. Which host has a larger share of language events? Calculate both percentages and name one thing these counts cannot tell you.
Lesson moves
Ways to Teach It
Give pairs 40 fictional event cards labeled by host and topic; have them sort the cards into a two-way table and compare rates.
Ask, 'Does a higher share of language events prove that one community values language more?' Have students answer using the table.
Play 'count or percent?': give teams event-count cards and host-total cards, then have them calculate and defend the correct within-host rates.
Use publicly posted calendars from a Montana tribal college and a nearby library to tally language events and other events by host.
Free download
Printable MT.CORE.DATA.INT.7.c Worksheet
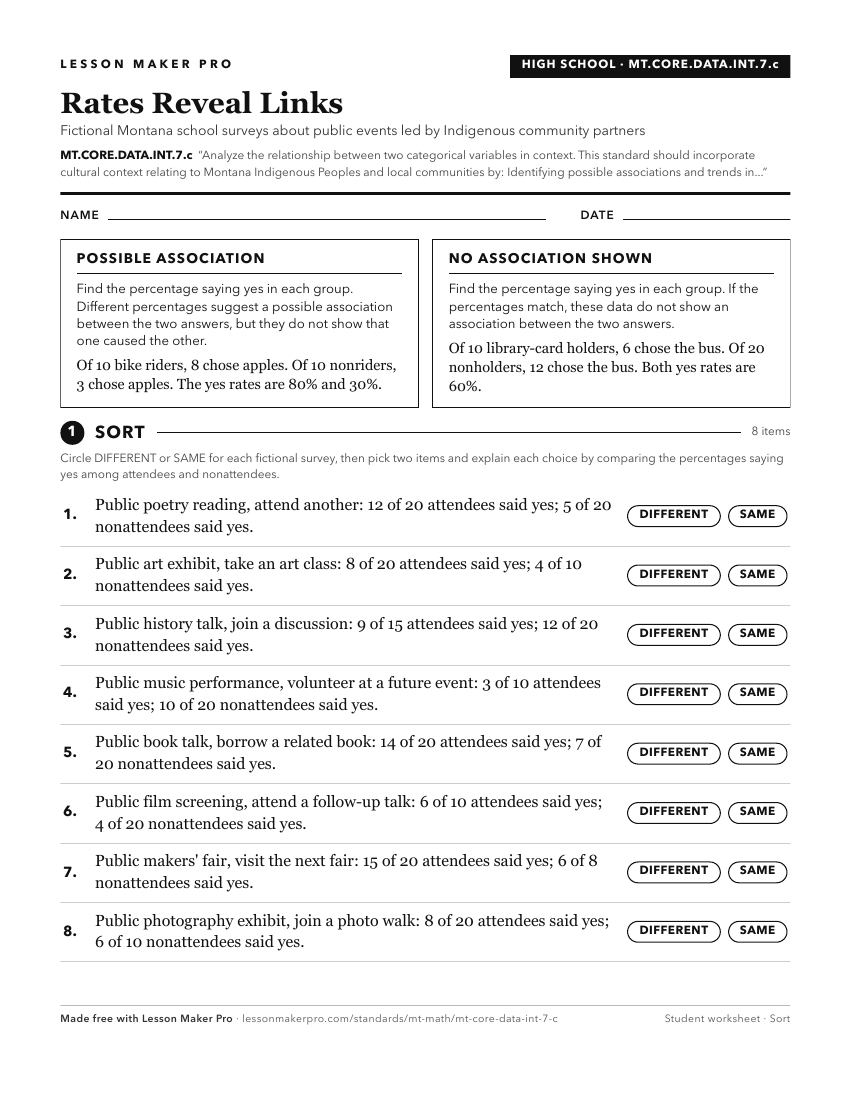
A ready-to-print activity worksheet aligned to MT.CORE.DATA.INT.7.c, with an answer key for the teacher on its own page. No account needed.
PDF, US Letter, prints cleanly in black and white.
Download the worksheetKeep exploring
Related Standards
- MT.CORE.DATA.INT.7.a
Summarizing categorical data for two categories in two-way frequency tables and visual representations,
- MT.CORE.DATA.INT.7
Analyze the relationship between two categorical variables in context. This standard should incorporate cultural context relating to Montana Indigenous Peoples ...
- MT.1.MD.5
Organize, represent, and interpret data with up to three categories by: Asking and answering questions about the total number of data points, Identifying how ma...
- MT.CORE.DATA.INT.7.b
Interpreting relative frequencies for categorical data in context, and
Turn this exact standard into a lesson
Grade, subject, topic, and the complete standard are prefilled. Create one free, no account needed.
Also for this standard:Make a WorksheetMake a QuizMake a Sub Lesson