Montana Math MT.PLUS.DATA.INF.3
Standard Cluster
Use data from a randomized experiment to test the hypothesis that two groups are equal by: Interpreting the difference or ratio between the group means as the observed effect between the groups, and Understanding that an observed effect may be due to randomization and using a randomization test (repeatedly reshuffling the observed data into new groups) to determine the probability that an observed effect is due to randomization alone.
2026 Montana Mathematics Content Standards · Data Reasoning
Cluster contents
Standards in This Cluster
MT.PLUS.DATA.INF.3 is a cluster heading. These are the individual standards under it.
- MT.PLUS.DATA.INF.3.a
Interpreting the difference or ratio between the group means as the observed effect between the groups, and
- MT.PLUS.DATA.INF.3.b
Understanding that an observed effect may be due to randomization and using a randomization test (repeatedly reshuffling the observed data into new groups) to d...
Teacher's field guide
What This Cluster Means
What Students Need to Do
- Students calculate each group’s mean in a randomized experiment. They report the difference or ratio as the observed effect. They reshuffle all outcomes into groups of the same sizes to see how often an effect at least as extreme occurs by chance.
What Mastery Looks Like
- For means of 12 and 8, students can report a difference of 4 or a ratio of 1.5. They count how many reshuffles produce an effect at least as extreme, then use that fraction to judge whether random assignment could explain the result.
Common Misconceptions
- Students may treat any difference in means as proof that the treatment worked. Some shuffle values within each group instead of mixing all outcomes. Others read the reshuffle fraction as the probability that the groups are equal.
How to Assess It
- Exit ticket: Group A’s mean is 9 and group B’s is 7. Three of 20 reshuffles give an absolute mean difference of at least 2. Find the observed difference and estimate how often a result this extreme would occur if the treatment had no effect.
Lesson moves
Ways to Teach It
Label scores 6 to 9 control and 10 to 13 treatment; shuffle into fours 20 times, counting absolute mean differences at least 4.
Ask: If treated plants average 12 cm and untreated plants average 8 cm, why might that difference occur without a treatment effect?
Pairs split cards numbered 6 to 13 into fours ten times; score one point for each absolute mean difference of 4 or more.
Present shoppers’ totals from randomly assigned coupons: A, $8, $10, $12, $14; B, $6, $8, $10, $12. Shuffle totals and compare means.
Free download
Printable MT.PLUS.DATA.INF.3 Worksheet
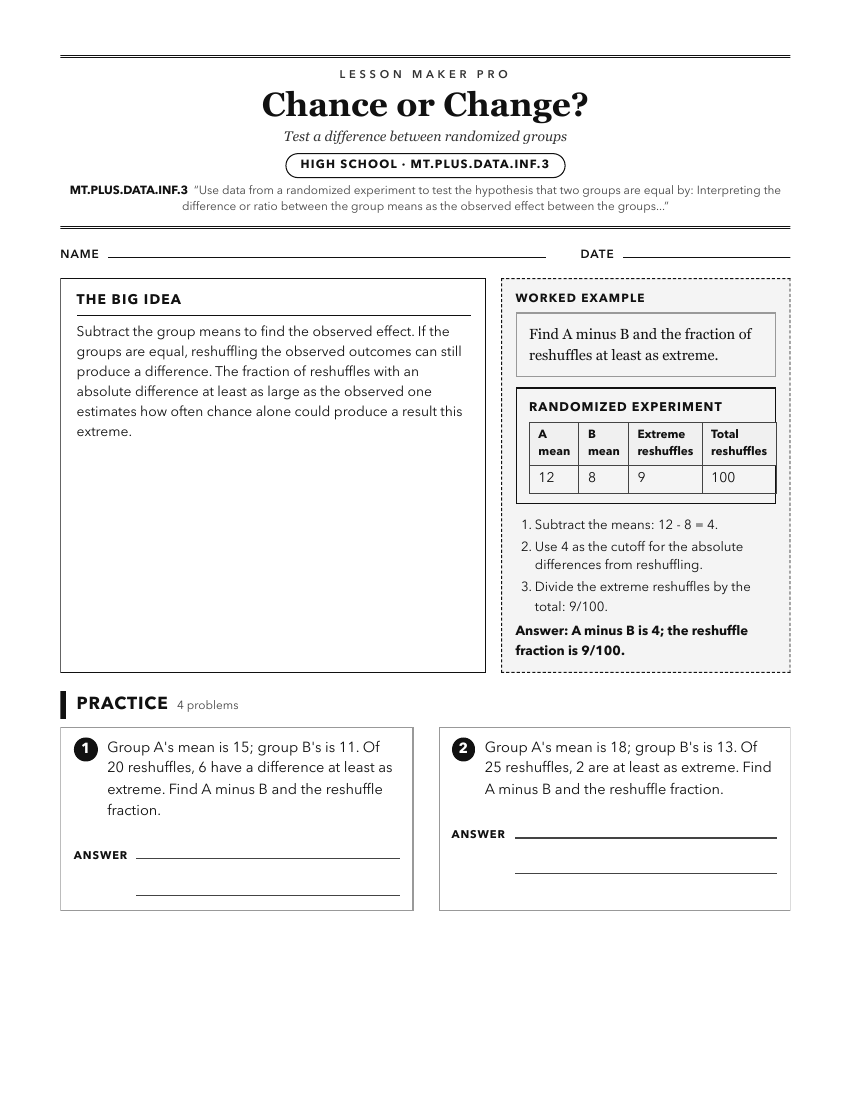
A ready-to-print activity worksheet aligned to MT.PLUS.DATA.INF.3, with an answer key for the teacher on its own page. No account needed.
PDF, US Letter, prints cleanly in black and white.
Download the worksheetKeep exploring
Related Standards
- MT.PLUS.DATA.DES.2.a
Explaining the consequences, due to uncontrolled variables, of non-randomized assignment of subjects to groups in experiments, and
- MT.PLUS.DATA.DES.2
Describe differences between randomly selecting samples and randomly assigning subjects to experimental treatment groups in terms of inferences drawn regarding ...
Turn this cluster into a lesson
Grade, subject, topic, and the complete cluster are prefilled. Create one free, no account needed.
Also for this cluster:Make a WorksheetMake a QuizMake a Sub Lesson