Montana Math MT.PLUS.DATA.DES.2.a
The Standard
- MT.PLUS.DATA.DES.2
- Describe differences between randomly selecting samples and randomly assigning subjects to experimental treatment groups in terms of inferences drawn regarding a population versus regarding cause and effect by: Explaining the consequences, due to uncontrolled variables, of non-randomized assignment of subjects to groups in experiments, and Evaluating where bias, including sampling, response, or nonresponse bias, may occur in surveys, and whether results are representative of the population of interest.
Describe differences between randomly selecting samples and randomly assigning subjects to experimental treatment groups in terms of inferences drawn regarding a population versus regarding cause and effect by: Explaining the consequences, due to uncontrolled variables, of non-randomized assignment of subjects to groups in experiments, and
2026 Montana Mathematics Content Standards · Data Reasoning
Teacher's field guide
What This Standard Means
What Students Need to Do
- Students tell apart selecting people at random from a population and assigning people at random to treatment groups. They decide when results can describe a population and when they can support a cause-and-effect claim. They explain how people choosing their own group can affect the results.
What Mastery Looks Like
- Given a study, a student identifies how people were selected and how groups were formed. For a randomly selected group that chooses whether to attend tutoring, they can describe a schoolwide pattern but cannot claim tutoring caused higher scores. They name motivation as a possible explanation for the score gap.
Common Misconceptions
- Students may think a random sample makes treatment groups comparable. They may think random assignment makes a volunteer sample represent everyone. They may also treat a score gap as proof that tutoring worked, even when students chose their own group.
How to Assess It
- Exit ticket: A school randomly selects 60 students, lets them choose whether to attend tutoring, and finds higher scores among those tutored. Can the results describe a schoolwide pattern? Do they show that tutoring caused higher scores? Name one other possible explanation.
Lesson moves
Ways to Teach It
Put 20 labeled student cards in a bag, draw eight for a sample, then flip coins to assign those eight to two groups.
Ask: Students choose whether to attend tutoring, and tutored students score higher. Could motivation explain the gap? Write two sentences.
Give pairs four study cards showing random or volunteer selection and coin-flip or choice-based groups; have them sort population claims from cause claims.
Compare a random survey of students' bus use with a coin-flip trial testing whether free bus passes improve attendance; label each supported conclusion.
Free download
Printable MT.PLUS.DATA.DES.2.a Worksheet
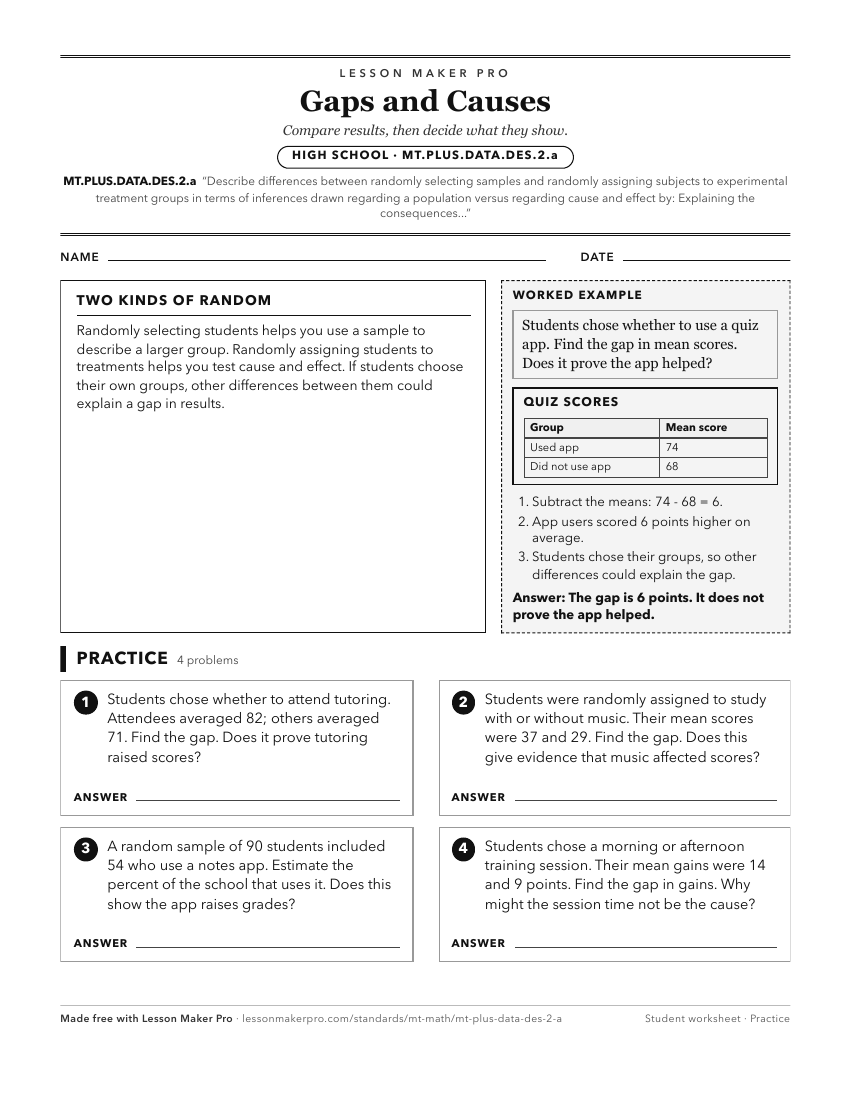
A ready-to-print activity worksheet aligned to MT.PLUS.DATA.DES.2.a, with an answer key for the teacher on its own page. No account needed.
PDF, US Letter, prints cleanly in black and white.
Download the worksheetKeep exploring
Related Standards
- MT.PLUS.DATA.INF.3.b
Understanding that an observed effect may be due to randomization and using a randomization test (repeatedly reshuffling the observed data into new groups) to d...
- MT.PLUS.DATA.DES.2
Describe differences between randomly selecting samples and randomly assigning subjects to experimental treatment groups in terms of inferences drawn regarding ...
- MT.PLUS.DATA.INF.3.a
Interpreting the difference or ratio between the group means as the observed effect between the groups, and
- MT.PLUS.DATA.INF.3
Use data from a randomized experiment to test the hypothesis that two groups are equal by: Interpreting the difference or ratio between the group means as the o...
Turn this exact standard into a lesson
Grade, subject, topic, and the complete standard are prefilled. Create one free, no account needed.
Also for this standard:Make a WorksheetMake a QuizMake a Sub Lesson