Montana Math MT.CORE.DATA.PROB.2
Standard Cluster
Understand the concepts of conditional probability and independence in context. This standard should incorporate cultural context relating to Montana Indigenous Peoples and local communities by: Determining whether two events, A and B, are independent by using two-way tables, tree diagrams, and/or Venn diagrams, and interpreting the answer in context, and Computing the conditional probability of event A given event B by using two-way tables, tree diagrams, and/or Venn diagrams, and interpreting the answer in context.
2026 Montana Mathematics Content Standards · Data Reasoning and Probability
Cluster contents
Standards in This Cluster
MT.CORE.DATA.PROB.2 is a cluster heading. These are the individual standards under it.
- MT.CORE.DATA.PROB.2.a
Determining whether two events, A and B, are independent by using two-way tables, tree diagrams, and/or Venn diagrams, and interpreting the answer in context, a...
- MT.CORE.DATA.PROB.2.b
Computing the conditional probability of event A given event B by using two-way tables, tree diagrams, and/or Venn diagrams, and interpreting the answer in cont...
Teacher's field guide
What This Cluster Means
What Students Need to Do
- Students use a two-way table, tree diagram, or Venn diagram to find the probability of one event within a named group. They compare it with the overall probability to decide whether two events are independent, then explain what the numbers mean.
What Mastery Looks Like
- In a survey, a student finds that 16 of 20 attendees traveled at least 30 miles, so the probability among attendees is 0.8. They compare it with the overall rate of 20 out of 40, or 0.5, and explain why the events are not independent.
Common Misconceptions
- Students divide by everyone surveyed instead of just the group named after 'given.' They confuse the probability of traveling given attendance with the probability of attendance given travel. Some treat 'independent' as meaning the events cannot happen together.
How to Assess It
- Exit ticket: In a fictional survey of 40 people, 16 of 20 Arlee Celebration attendees and 4 of 20 nonattendees traveled at least 30 miles that day. Find the probability of traveling at least 30 miles given attendance, then decide whether travel and attendance are independent.
Lesson moves
Ways to Teach It
Give pairs 40 paper slips matching the fictional Arlee Celebration survey counts; have them sort the slips into a two-way table.
Ask, 'Why is the travel rate different among attendees than among everyone surveyed?' Have students defend their answers with numbers from the table.
Run a table-to-tree relay: pairs redraw the survey counts as a tree diagram, then check another pair's conditional probability.
Show an Arlee Celebration flyer and ask how a voluntary, anonymous travel survey could help organizers plan parking or shuttles.
Free download
Printable MT.CORE.DATA.PROB.2 Worksheet
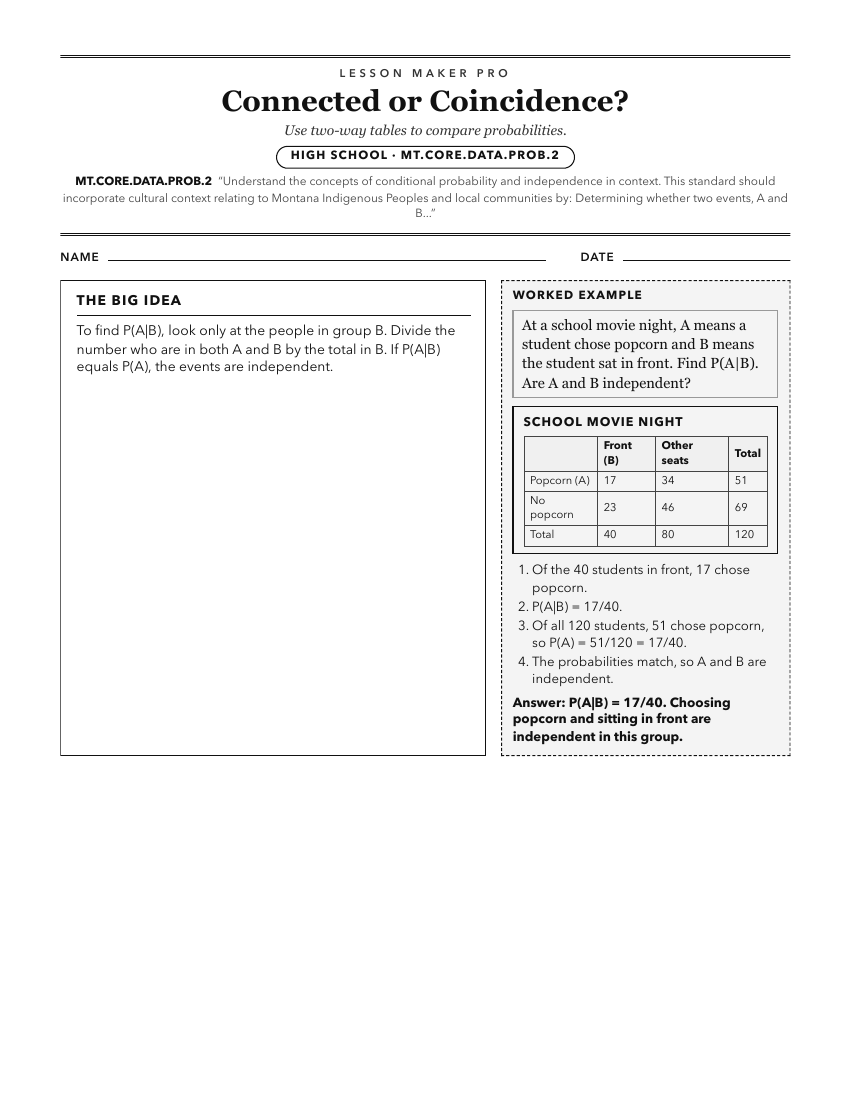
A ready-to-print activity worksheet aligned to MT.CORE.DATA.PROB.2, with an answer key for the teacher on its own page. No account needed.
PDF, US Letter, prints cleanly in black and white.
Download the worksheetKeep exploring
Related Standards
- MT.CORE.DATA.INT.7
Analyze the relationship between two categorical variables in context. This standard should incorporate cultural context relating to Montana Indigenous Peoples ...
- MT.7.SP.6
Find the experimental probability of a chance event by collecting data on the chance process that produces it and observing its long-run relative frequency. Thi...
- MT.8.SP.4
Construct and interpret frequencies and relative frequencies for bivariate categorical data in a two-way table to investigate patterns of association. This stan...
Turn this cluster into a lesson
Grade, subject, topic, and the complete cluster are prefilled. Create one free, no account needed.
Also for this cluster:Make a WorksheetMake a QuizMake a Sub Lesson