Mississippi Science ESS.2B.5
The Standard
- ESS.2B
- Students will develop an understanding of the history and evolution of the earth.
Use mathematical representations to interpret seismic graphs to triangulate the location of an earthquake’s epicenter and magnitude and to correlate the frequency and magnitude of an earthquake.
2026 Mississippi College- and Career-Readiness Standards for Science · Earth Structure and History
Teacher's field guide
What This Standard Means
What Students Need to Do
- Students read P- and S-wave arrival times on seismograms and use the time gaps to find each station’s distance from an earthquake. They draw distance circles from three stations to locate the epicenter. They use wave amplitude and distance to estimate magnitude, then compare how often earthquakes of different magnitudes occur.
What Mastery Looks Like
- A student identifies both wave arrivals, reads the distances from a travel-time graph, and draws three circles that meet near one point. They estimate magnitude with an amplitude-and-distance chart and explain that smaller earthquakes occur more often than larger ones.
Common Misconceptions
- Students may mistake the first large spike for the P-wave arrival or use arrival time alone to find distance. Some put the epicenter at the nearest station or judge magnitude by wave height without accounting for distance.
How to Assess It
- Give students three labeled seismograms, a travel-time graph, a station map, and an amplitude-and-distance magnitude chart. Ask them to mark the epicenter, estimate magnitude, and use a small earthquake count table to name the most common magnitude range.
Lesson moves
Ways to Teach It
Use printed seismograms, a ruler, and a station map to draw distance circles from three P-to-S time gaps.
Ask partners: “Why might a tall wave at a distant station give a misleading impression of magnitude?”
Give pairs four possible epicenters on a map; have them race to match three seismograms to the correct point.
Graph earthquake counts by magnitude from a recent USGS list and identify which magnitude range occurred most often.
Free download
Printable ESS.2B.5 Worksheet
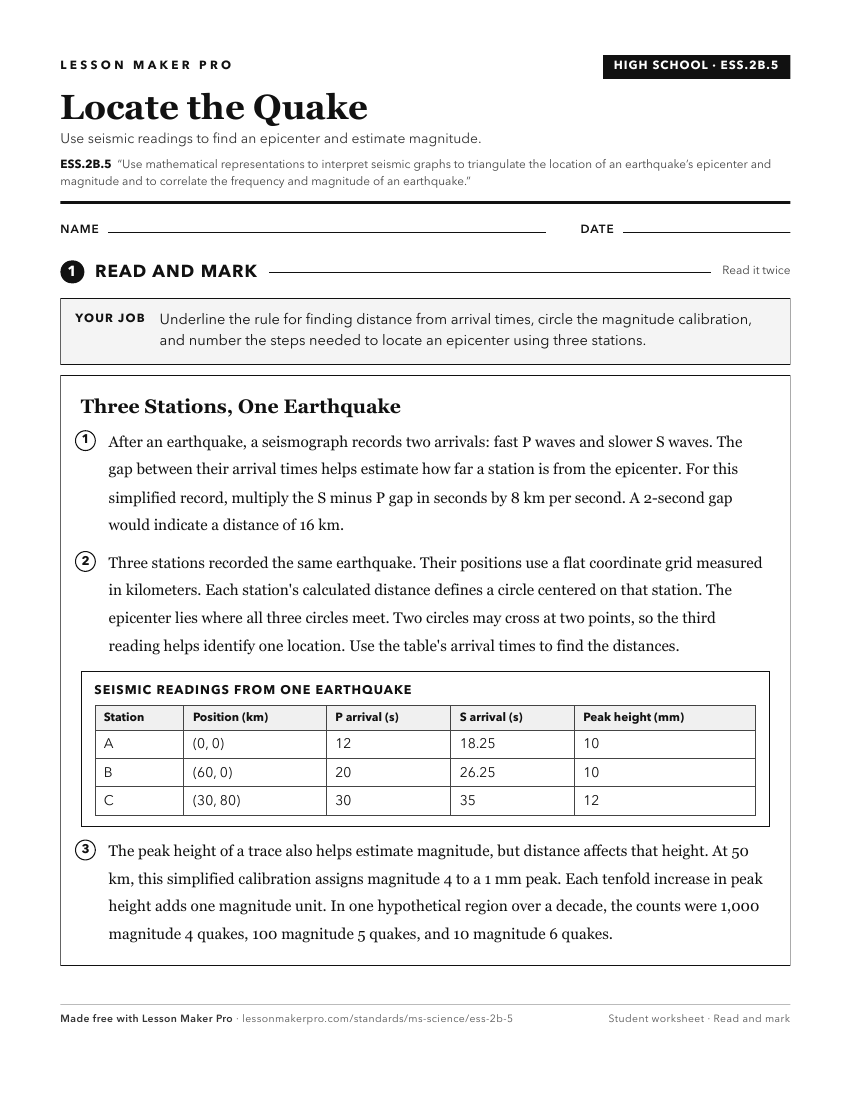
A ready-to-print activity worksheet aligned to ESS.2B.5, with an answer key for the teacher on its own page. No account needed.
PDF, US Letter, prints cleanly in black and white.
Download the worksheetKeep exploring
Related Standards
- ESS.4.3
Analyze earthquake and volcanic data to determine patterns that can lead to predicting such hazards and mitigating impact to humans.
- ESS.2A.2
Analyze and interpret data to explain and communicate the differentiation of Earth’s physical divisions (e.g., lithosphere and asthenosphere) using data from se...
- E.4.9C.1
Analyze and interpret data to describe (i.e., NASA, NOAA, USGS) and predict how natural processes (e.g., weathering, erosion, deposition, earthquakes, tsunamis,...
- MAQ.3.1
Use geospatial data to analyze, explain, and communicate differences among the major geological features of specific aquatic ecosystems (e.g., plate tectonics, ...
Turn this exact standard into a lesson
Grade, subject, topic, and the complete standard are prefilled. Create one free, no account needed.
Also for this standard:Make a WorksheetMake a QuizMake a Sub Lesson